The right-side panel is missing
Check the Chart Trader toolbar menu or the Chart Trader property in the chart’s Properties window.

Synthetic MES 5-minute candles. Times are bar closes in ET.
In the fictional order record, Sim101 carries one MES December contract with a sell stop working at 5,995.00. With the same account and dated instrument selected, the chart can display that resting stop. Verify its side, quantity and state in Control Center → Orders.
Check the Chart Trader toolbar menu or the Chart Trader property in the chart’s Properties window.
Verify the account, dated contract, order state and working price in Control Center.
Check the selected data series and its Plot Executions option.
For the illustrative MES December stop, start with the relevant record and then compare it to the chart.
Open the chart’s Chart Trader toolbar menu and choose Chart Trader. The same setting is available from the chart’s Properties dialog. Chart Trader (Hidden) leaves the chart order and position display enabled and keeps chart order commands available through the right-click menu. A fully disabled view removes Chart Trader functionality from that chart.
Before using a trading control, verify the selected account, dated contract, quantity and ATM Strategy. If you switch between chart tabs, the Chart Trader Properties option Use tab specific selections lets each tab keep its own account, quantity and ATM choice. Check what the active tab shows after switching.
Open Control Center → Orders and review the account and status filters. Find the correct dated contract, action, price and state. Compare with Positions for remaining exposure. A Rejected, Cancelled or Filled row tells a different story from a resting stop. If the connection is stale or the order state is unclear, confirm through the broker’s order view before taking further action.
Return to the chart and choose the exact account and contract shown in the Orders row. On a multi-series chart, use Chart Trader’s Instrument dropdown to pick the intended series. An MES chart for another expiry or an MNQ series shows its own instrument’s order and position information. On a single-instrument chart, the Instrument dropdown can be disabled because the chart already determines it.
If the identifiers match and the order is resting, check whether its price is inside the visible price range. Zoom out in simulation to see where it should appear. If an ATM stop never became active or shows a rejection, inspect that order and the Control Center Log before making another submission.
In NinjaTrader Desktop, the standard Close action covers the position and working orders for the selected account and dated instrument. NinjaTrader documents middle-clicking Close with an active ATM selected to close just that ATM’s position. Confirm the selected account, instrument, and active strategy in simulation before using either control.
Suppose Sim101 is long two MES in one expiry. One contract belongs to ATM A, and one to ATM B. Each has its own stop and target. If the close of ATM A completes, expect one MES still long. Check whether ATM B’s one-contract stop and target remain working. If you use the standard position close and it completes, expect both MES contracts closed and the working orders for that account and instrument canceled.
Verify the closing quantity in Control Center → Executions, the remaining position in Positions, and each bracket’s status in Orders. A chart that displays only the selected strategy can hide other orders. Control Center’s Flatten Everything has a wider scope, so check other accounts and contracts separately when you use it. If a fill or cancellation is pending, confirm the broker’s current records before repeating a close.
A market order does not appear as a resting order line in Chart Trader. Check Executions for the actual fill. In the chart’s Data Series settings, select the relevant series and change Plot Executions to Markers only or Text and Marker if you want to see historical executions in the displayed bars.
Rehearse the distinction in a simulator. Use a separate simulation workspace, confirm the account selector, then compare a simulated resting order, a fill in Executions and an old marker with plotting enabled. Each view answers a different question.
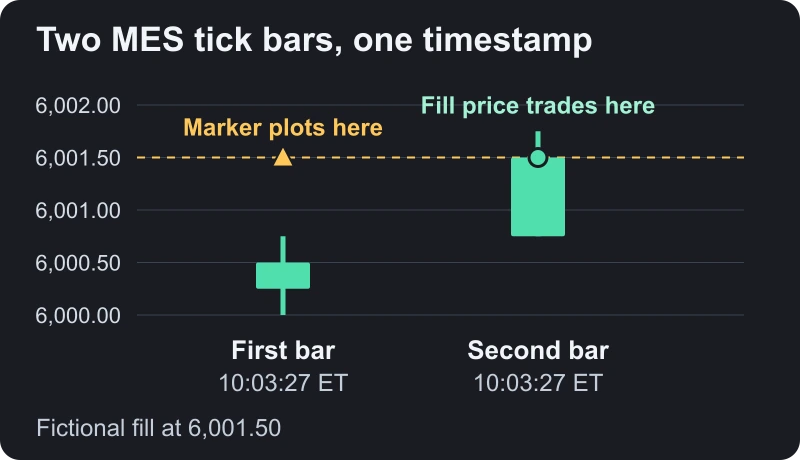
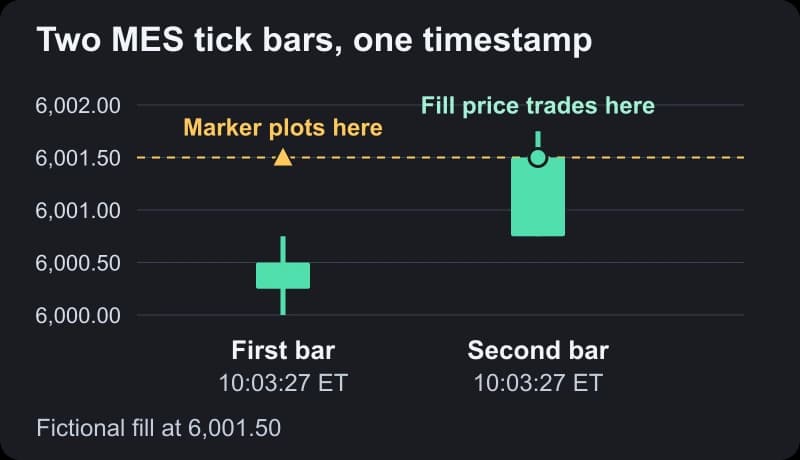
NinjaTrader places execution markers by timestamp. When two tick bars share a timestamp, the marker can appear on the first bar even if the execution price traded during the second. In this fictional MES example, both bars end at 10:03:27 ET. The first bar tops out at 6,000.75 and the second trades from 6,000.75 to 6,001.75. The recorded buy of one contract at 6,001.50 plots three price ticks above the first bar’s high. The second bar covers that price.
Start with the fill record. For today’s fill, open Control Center → Executions and check the account, dated contract, action, quantity, price, and time. Use the execution ID to distinguish individual fills when one order fills in pieces. For an older fill, use Trade Performance → Executions. Right-click the row and choose Chart to open NinjaTrader’s temporary one-minute view if historical data is available. Use it to locate the minute, then inspect neighboring tick bars on the same contract to check for the shared timestamp.
If several markers appear consistently early or late, compare the chart and execution times in the same time zone. NinjaTrader documents that some providers supply the timestamp and that the platform can instead stamp it locally. Check the timestamp source and Windows clock sync if the execution is stamped locally. For a live trade that still looks inconsistent, compare the recorded fill with the broker’s execution report and keep the order and execution IDs for support.
Platform details on this page were checked against these official resources.
Restore a layout before checking the chart account and contract.
Check the dated chart, position and working orders separately after switching months.
Rehearse chart controls with the intended simulated account selected.
Match each fill by timestamp, price and quantity before importing it into your journal.
Reconcile the order row, log, fills and positions.
Check the stop and target quantities after an entry fills.
Compare Auto Breakeven and Auto Trail after their respective triggers.
Compare Time & Sales with a plain chart and check script utilization.
Chart Trader (Hidden) collapses the right-side panel while retaining the chart’s order and position display. Use the toolbar menu and choose Chart Trader to restore the full panel.
Changing the view is a display action. Confirm whether an order is still active in Control Center → Orders or through the broker if the platform connection is unclear.
With one instrument on the chart, the chart already determines the instrument. On a multi-instrument chart, the dropdown lets you select which series Chart Trader applies to.
NinjaTrader plots fills by timestamp. If several tick bars share one timestamp, the first can receive the marker even if the fill price traded on a later bar. Compare the execution row’s time and price with the neighboring bars on the same dated contract.
Futures trading contains substantial risk and is not suitable for every investor. TradeReign is a trading-discipline and rule-enforcement application. It does not provide trading advice, trade signals, investment recommendations, or performance guarantees.
TradeReign is not a broker-dealer, futures commission merchant, or investment advisor.
Futures trading contains substantial risk and is not for every investor. An investor could potentially lose all or more than the initial investment. Only risk capital - money that can be lost without jeopardizing financial security or lifestyle - should be used for trading. Past performance is not necessarily indicative of future results.