Confirm the chart clock
In Eastern time, the three end stamps are 9:35, 9:40, and 9:45. In Central time, they are 8:35, 8:40, and 8:45.

Synthetic MES 5-minute candles. Times are bar closes in ET.
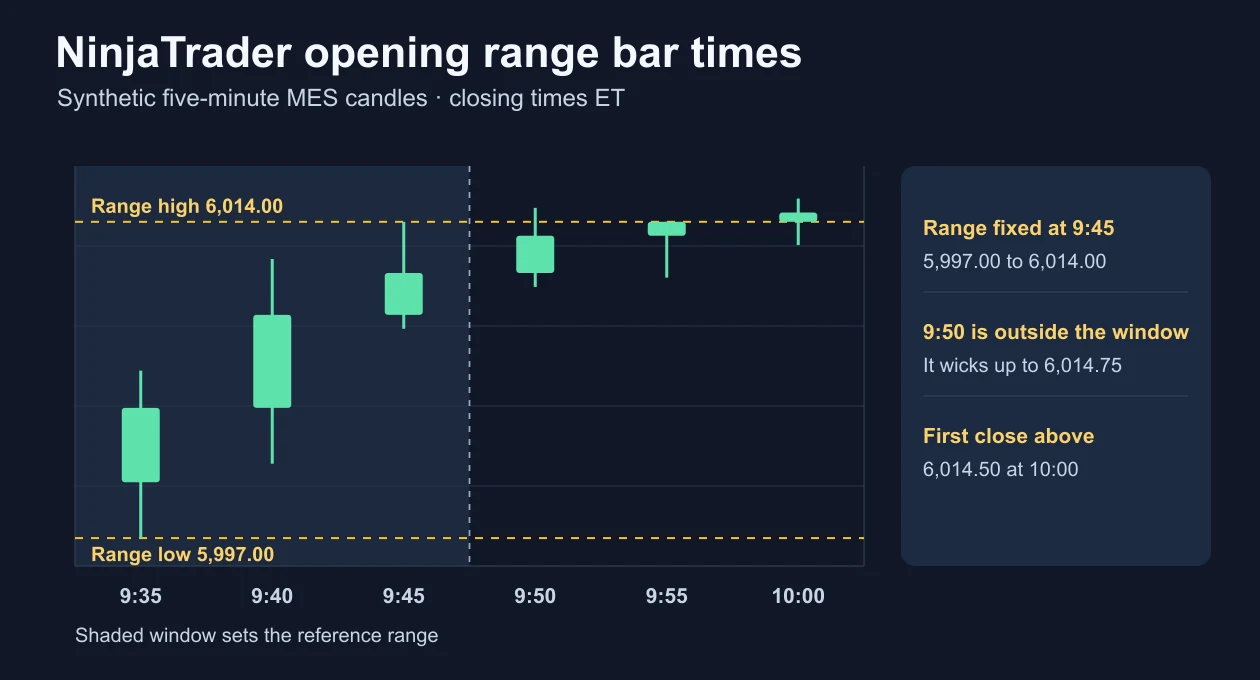
Synthetic five-minute MES bars in Eastern time. The range finishes at 9:45 a.m. Its high is 6,014.00 and its low is 5,997.00. The bar stamped 9:50 wicks above the completed range.
In Eastern time, the three end stamps are 9:35, 9:40, and 9:45. In Central time, they are 8:35, 8:40, and 8:45.
Use the Data Box highs and lows, including the wicks.
Later bars can break the range. Their highs and lows stay outside the range calculation.
Open a NinjaTrader Desktop chart for the contract and date you want to study. In Data Series, use five-minute bars and check that the Trading Hours template includes the 9:30–9:45 a.m. ET window. To check the platform time zone, open Tools → Options → General and find Time zone. Convert the example times to your existing setting so there’s no need to change the clock for every chart.
Right-click the chart and choose Show Data Box. Move the cursor over each of the three completed bars and write down its high and low. In the synthetic chart above, the 9:35 bar supplies the low of 5,997.00 and the 9:45 bar supplies the high of 6,014.00. From Drawing Tools, choose Horizontal Line and place one line at each price. Check their prices against the levels you wrote down.
Find the indicator’s input series, start time, duration, and time-zone convention. If the tool starts at the Trading Hours template’s session boundary, confirm that boundary is the opening you intend to measure. An extended-hours template can include the cash-open bars and still start the session the prior evening.
Compare the indicator’s completed range with your two lines for the same contract and date. In this sample, dropping the 9:35 bar and including the 9:50 bar shifts the range to 6,001.00–6,014.75. That is a one-bar-late window. A mismatch in a real chart is a reason to check the window first, then confirm the bar interval, input series, template, and contract.
Current Day OHL tracks the evolving session high and low. Use the two manually fixed lines to audit a completed 15-minute window. If you use a separate ORB indicator, verify that its lines stay at the completed levels as new bars arrive.
In a replay exercise that requires a close strictly above the high, the bar stamped 9:50 wicks above 6,014.00 and closes back at 6,013.25. The 9:55 close equals the high. The 10:00 close of 6,014.50 is the first one that qualifies. A touch-based rule can respond earlier. Mark the first bar your rule recognizes and record separately whether an order would have been placed and filled under your chosen execution assumptions.
Platform details on this page were checked against these official resources.
Use the same MES example to compare opening and closing stamps.
Use Playback to inspect each completed candle in sequence.
Check the session template, contract, and available historical data.
See how the first-hour high and low form on a longer window.
NinjaTrader stamps time-based bars by their closing time. On a five-minute Eastern-time chart, the bar starting at 9:30 is stamped 9:35, and the bar closing at 9:45 completes the 15-minute range.
Yes. Use the Data Box to read the first three five-minute bars after the chosen start, then draw horizontal lines at their highest high and lowest low after the window closes.
First compare the bars by the time span each represents. NinjaTrader’s closing stamps can look five minutes later than a five-minute chart labeled by opening time. Then compare the dated contract, data feed, Trading Hours template, and indicator window.
Futures trading contains substantial risk and is not suitable for every investor. TradeReign is a trading-discipline and rule-enforcement application. It does not provide trading advice, trade signals, investment recommendations, or performance guarantees.
TradeReign is not a broker-dealer, futures commission merchant, or investment advisor.
Futures trading contains substantial risk and is not for every investor. An investor could potentially lose all or more than the initial investment. Only risk capital - money that can be lost without jeopardizing financial security or lifestyle - should be used for trading. Past performance is not necessarily indicative of future results.