Size
Calculate the proposed loss at the stop, including costs.

Synthetic MES 5-minute candles. Times are bar closes in ET.
The synthetic long enters at 6,005.00 and the stop is 5,995.00. The 10:25 candle crosses the stop. The dollar comparison assumes a fill at the stop plus a separate cost allowance.
Calculate the proposed loss at the stop, including costs.
Check whether the same entry would qualify before the win.
Track attempts and session limits even when P&L is positive.
Suppose the session is already up $80 net. The next fictional trade has a 10-point stop and a $75 prewritten risk limit. MES is $5 per point. Allow $3 per contract for round-trip fees and slippage.
The chart and stop are identical. Position size changes the dollar outcome. Actual fills and costs can differ from the estimate.
Keep a copy of the original entry criteria and limits. Compare each proposed trade with those rules. Common changes to check are entering on a wick when the setup requires a close, adding a contract while leaving the stop in the same place, or taking an extra attempt after reaching a daily trade limit.
Record the deviation even if it makes money. If the trade was within the plan and still lost, keep the loss separate from execution quality. That matters when reviewing whether anything should change.
Barber and Odean found that the most active households in their stock brokerage sample earned lower returns. They discussed overconfidence as one possible explanation. The study measures stock investors’ outcomes and gives no estimate of what will happen to a particular futures trader after a win.
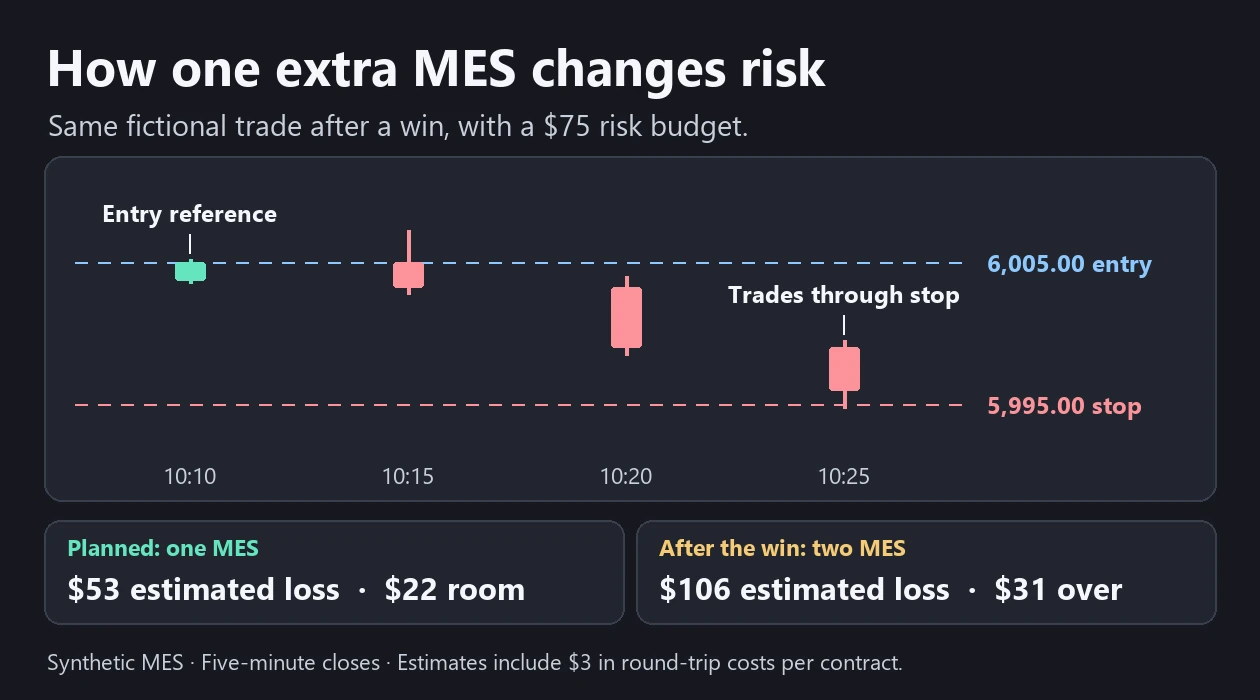
A size increase can follow a written plan. It needs a rule set before the trade, a review point and enough remaining risk room. In the example, two contracts require an estimated $106 at the same stop. A preplanned $110 budget could fit two, but a tighter $95 remaining limit would bring the effective budget below $106 and leave room for one.
Check the current account cap and your open positions as separate constraints. If the only change is the previous trade’s profit, use the risk limits that were already in force. Review any change to the sizing rule outside the session with the evidence that would justify it.
Keep size fixed and check two rules independently. In this fictional MES replay, the plan allows one contract per trade and at most two filled opening trades in the session. For the marked setups, wait for a five-minute close strictly above the level. The first trade has already closed profitably at 9:45 ET, leaving one entry under the cap.
At 9:50, MES trades above 6,004 but closes at 6,002.75. Log “no entry trigger.” At 10:05, it closes at 6,004.75 and the exercise assumes an entry on the next bar. The trader exits by 10:20. At 10:30, a separate setup closes at 6,008.75, above its 6,008 level. Log “setup qualified, session cap reached.” This time the setup passes and the session limit blocks the entry.
Pause the replay at each decision. Write the level, closing price, entries used and reason for taking or passing. When reviewing your week, keep premature entries and cap breaches separate. An entry can violate both rules, so tag both and count it once in the total number of off-plan entries. A later rally leaves both earlier decisions unchanged.
Synthetic MES 5-minute candles. Times are bar closes in ET.
At 9:50 ET the wick crosses 6,004 but the close stays below. At 10:05 an eligible close above 6,004 leaves room for the second entry. By 10:30 the new setup clears 6,008, but the session’s two-entry limit is already used.
After a profitable trade, it can feel easier to risk some of the session's gains. Thaler and Johnson observed greater willingness to take risk after prior gains in experiments and called it the house-money effect. Use it as a prompt to inspect what you changed after a win.
Frino, Grant and Johnstone found a pattern consistent with the house-money effect in historical trades by professional locals on the Sydney Futures Exchange. Use your own records to check whether prior gains coincide with a change in position risk. The study describes that historical group of traders.
Suppose your written simulation plan activates a $120 realized P&L floor after the session first reaches +$200 net. You're flat at +$240, then take an eligible trade that costs $50 net. At +$190 you have $70 above the floor. If another eligible setup has estimated risk of $43 per contract including costs, one contract would leave $27 of room. Two contracts would cost an estimated $86 and would put you $16 below your floor. Skip the trade if the smallest eligible size cannot fit. A stop fill can be worse than estimated, so the floor is a decision rule for this exercise.
After the session, mark when the floor first activated and record every subsequent setup, including those you passed. For each trade, write down realized P&L before entry, estimated risk, realized result and any rule you changed. Separate planned losses from late entries, added size or extra attempts. After a sample of sessions, compare rule adherence and how much the planned passes would have changed results using the same fill and cost assumptions.
In your journal, keep one row for the first eligible setup after each completed winning trade. Record the prior outcome, setup version, planned contracts, proposed contracts, stop distance, estimated total risk and whether you followed the rule. Record sessions with no next eligible setup separately.
For a comparison, keep the same fields after losses and compare like setups under the same rule version. To calculate a sizing deviation rate, divide the number of recorded eligible setups with a risk or quantity breach by the number with known sizing decisions. Keep skipped, unknown and unfilled cases visible. Use the rate to inspect decisions rather than to estimate a trading edge.
For example, suppose you can score 20 decisions after wins and 16 after losses under the same setup and sizing rule. Six breaches after wins give 30%. Two after losses give 12.5%. If four post-win decisions and one post-loss decision are unresolved, report those counts alongside the rates. A larger proportion after wins is a reason to review the logged decisions. The small sample and missing decisions limit what the comparison can show.
Platform details on this page were checked against these official resources.
See how the same session can trigger a rule based on open P&L while closed P&L stays above its threshold.
Compare the stop, cost allowance, margin and account caps.
Keep the execution review separate from P&L.
Use comparable rules to score a valid pass and an unplanned missed entry.
Review how exit decisions can drift when the trade moves against you.
Compare a short streak with earlier trades before changing your plan.
Check additional attempts against the limits you set for the session.
FOMO describes pressure to catch a move you might miss. Overconfidence describes estimating your skill or the setup’s reliability too highly. Both can appear in the same order, so record the rule that changed.
Check the sizing policy you committed to before the trade and all current limits. The increase can be within plan if the rule allows it and the estimated loss fits the remaining budget.
Yes. Record any deviation from the plan before using the trade’s profit or loss to judge execution.
Futures trading contains substantial risk and is not suitable for every investor. TradeReign is a trading-discipline and rule-enforcement application. It does not provide trading advice, trade signals, investment recommendations, or performance guarantees.
TradeReign is not a broker-dealer, futures commission merchant, or investment advisor.
Futures trading contains substantial risk and is not for every investor. An investor could potentially lose all or more than the initial investment. Only risk capital - money that can be lost without jeopardizing financial security or lifestyle - should be used for trading. Past performance is not necessarily indicative of future results.