Before a trade
Write the conditions that qualify an entry, its maximum planned risk, and the limits that end the session.

Write the conditions that qualify an entry, its maximum planned risk, and the limits that end the session.
Record your rule adherence and net result in separate fields. Check the order history if a fill or stop looks wrong.
Evaluate the setup and the way you executed it. Keep changes in a new version you can compare in replay.
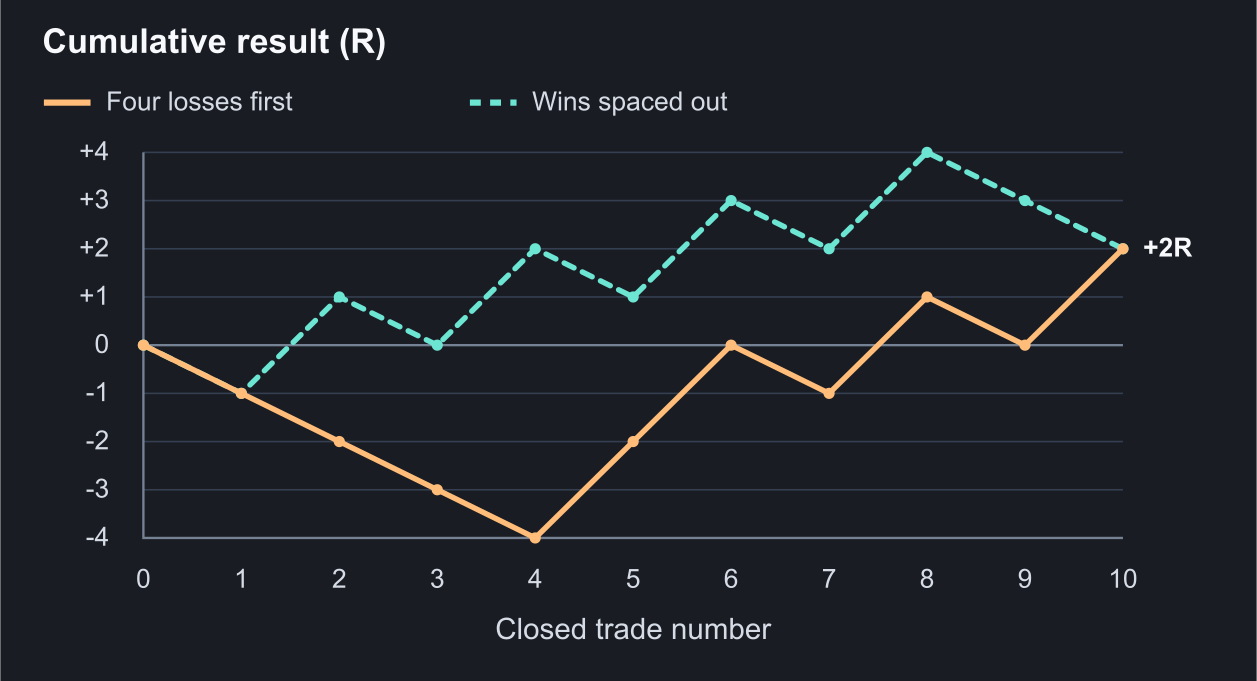
Assume a simplified setup wins 40% of the time, with +2R per win and −1R per loss after costs. Its expected result under those assumptions is 0.40 × 2R − 0.60 × 1R = +0.20R per trade. This is the model’s average. The chart holds the mix of wins and losses fixed and changes only their order, so both sequences finish at +2R.
If each trade is independent and has the same 60% chance of losing, the chance that your next four trades all lose is 0.60⁴ = 12.96%. That calculation answers a question about four specified trades. Counting whether a streak happens anywhere in a longer sample involves more possible starting points, and those windows can overlap.
Real trades can share exposure to the same session, volatility, news event or setup failure. A short backtest can also misestimate the loss rate. Use the calculation to understand how streaks arise in a simple model. When reviewing actual trades, check for common conditions across the losses and compare with other periods under the same rules.
At a constant 60% loss rate with independent trades, there is a 12.96% chance the next four trades all lose. Across 20 closed trades, there is about a 71.85% chance of four or more losses in a row somewhere in the sample. The calculator tracks the current streak length after each trade and counts a path once when it first reaches the target. That accounts for overlapping runs.
If your journal has scratches, decide how to label them. In the sequence loss, scratch, loss, treating a scratch as a break gives two separate losses. Skipping it gives a run of two losses among trades with nonzero P&L. Set Scratch rate to 10% and keep the loss rate at 60% of all trades. In 20 closed trades the chance of a four-loss run is still 71.85% if scratches break the run, and rises to 81.08% if you skip them. The other 30% of trades are wins in this example.
The model uses fixed rates and independent trades. If losses cluster by setup, market conditions, or time of day, compare the run with other samples from the same rule version. The two scratch definitions change how you describe the streak. Use your account’s actual P&L and limits to decide whether you have room for another trade.
Enter percentages based on all closed trades after costs. A scratch is an exactly net-zero trade. The closed trade count includes scratches in both calculations.
A qualifying entry stopped at the planned level belongs in the setup’s sample. A late entry with a bad fill belongs in your execution review too. A trade that breaks a rule belongs in the real account record even if you tag it separately from the as-planned setup results.
Write down what causes an immediate stop and what waits for review. A reached daily limit, an unconfirmed protective order or unexpected slippage can justify stopping right away. A run of otherwise valid losses gives you a reason to inspect execution, the market conditions and any prewritten drawdown limit. Keep the original rule intact for the comparison if you test a change later.
Pick one setup and one fixed rule version. For each eligible signal, record the session, the reason it qualified, the planned entry and stop, and the action you took before advancing the chart. Log a valid skip with its reason. Keep hypothetical fills separate from executed trades and use the same cost model for the replay sample.
After each result is visible, write the net outcome in R, the rule-adherence result, and whether the session risk limit still allows another attempt. At the review, count followed decisions out of eligible decisions and summarize net results and drawdowns. Make sure each number uses the sample it describes.
Platform details on this page were checked against these official resources.
Score three example trades and handle missing order evidence.
Compare approaches to uncertainty, tilt and structured trade review.
Check how win frequency and dollar outcomes contribute to the average.
Use one replay sample to see how a judgment call changes the outcome.
Choose what starts the timer and what must be true before the next entry.
Compare recent losses with earlier trades using the same setup and cost assumptions.
A streak can occur under unchanged odds or coincide with a real change in the setup, conditions or execution. Check the trade records, sample size and rule version, and respect any prewritten pause or drawdown limit.
In the simple independent model, the next trade still has the same 40% win probability. Actual trades can be related through market conditions, so use evidence about the current setup and keep the original position-size constraints.
Expectancy uses win frequency and the size of wins and losses after costs. A higher win rate can still have a lower net average if losing trades are much larger.
Futures trading contains substantial risk and is not suitable for every investor. TradeReign is a trading-discipline and rule-enforcement application. It does not provide trading advice, trade signals, investment recommendations, or performance guarantees.
TradeReign is not a broker-dealer, futures commission merchant, or investment advisor.
Futures trading contains substantial risk and is not for every investor. An investor could potentially lose all or more than the initial investment. Only risk capital - money that can be lost without jeopardizing financial security or lifestyle - should be used for trading. Past performance is not necessarily indicative of future results.