Commission
Enter a per-side amount when using currency per contract. The simulator applies it to both sides.

Synthetic MES 5-minute candles. Times are bar closes in ET.
The invented raw 9:45 bar opens at 6,004.00 and trades no lower than that price. Under the drill’s default next-bar fill timing, a market buy submitted on the 9:40 close uses the 9:45 bar’s open before any modeled slippage.
Enter a per-side amount when using currency per contract. The simulator applies it to both sides.
Enter ticks for modeled market and stop fills.
The current control for historical intrabar detail, previously called Bar Magnifier.
Suppose one MES long has a market entry that would otherwise fill at 6,000.00 and a stop-market exit that would otherwise fill at 5,996.00. MES is $5 per point and $1.25 per tick.
These prices and fees are hypothetical. If your own report already shows net P&L, use it as reported when reviewing the trade. Slippage is already reflected in the modeled fill prices.
Open Supercharts on your intended futures symbol and interval. In Indicators → Technicals → Strategies, add a built-in strategy for a practice run or add the Pine strategy you intend to test. A strategy opens the report below the chart. An indicator on its own only supplies chart data or signals.
Open Settings → Properties for the strategy. Confirm the account currency, initial capital, intended order quantity and margin assumptions. Check the actual quantity shown in Trades because a script can set order size itself. Record the dated contract, session and date range before running comparisons.
For an all-in fee quoted per contract per round trip, divide it by two before entering the Currency per contract commission setting. Include the costs you actually intend to model. A hypothetical $1.30 round trip is $0.65 per side. Enter slippage in ticks. TradingView applies the same setting to market and stop orders. Fixed slippage approximates an execution cost and does not predict an actual fill.
Look for Bar detalization in the strategy’s Properties or at the top of Strategy Report. TradingView replaced the old Bar Magnifier checkbox with this menu. Where High is available on your plan, it uses lower-timeframe prices when available to model historical fills in more detail.
Use a trade whose stop and target both fall inside the same chart candle to see why detail matters. If both orders were already working, the candle’s high and low alone cannot tell you which price came first. Compare the trade list with and without higher detail, using identical inputs otherwise. Higher detail can change the modeled order sequence. It still uses available historical bars.
TradingView documents a maximum of 200,000 requested lower-timeframe bars. Earlier trades may fall outside that coverage and use the default fill assumptions. Compare specific trades near the newest and oldest parts of the same test before treating High as a uniform change across the report.
Record Script execution settings along with bar detail. The default calculation runs after a completed bar, and a newly generated market order generally fills at the next available tick. On a historical bar-close test this usually means the next bar’s open. Other execution options can change when the script runs or how quickly an order can fill.
Open the strategy’s Settings → Properties and look for Limit order execution. Older help calls it Verify Price For Limit Orders. TradingView’s current Pine docs describe choices for filling when price reaches the limit or goes one tick beyond it. Pine uses backtest_fill_limits_assumption to set the default. For a buy limit, one tick beyond means one tick lower. For a sell limit, it means one tick higher.
Assume the same 6,000.00 MES buy limit is working before all four bars in the chart. The bar ending at 9:40 a.m. ET first reaches the limit. The 9:50 bar first trades one tick lower, at 5,999.75. The two settings can therefore record the entry in different bars. The verified model still records the order’s limit price of 6,000.00. If the strategy cancels an unfilled order at the 9:45 close, the one-tick version has no entry in this scenario.
Compare the two settings over the same dates. Keep Bar detalization, costs, and strategy inputs fixed. In Trades, record the changed entry time or the missing trade before comparing totals. A tick-through rule models price movement past your limit. It does not supply exchange queue position or a broker fill.
Synthetic MES 5-minute candles. Times are bar closes in ET.
The 9:40 ET bar touches the 6,000.00 order price. The 9:50 bar is the first to reach 5,999.75, one tick beyond the buy limit.
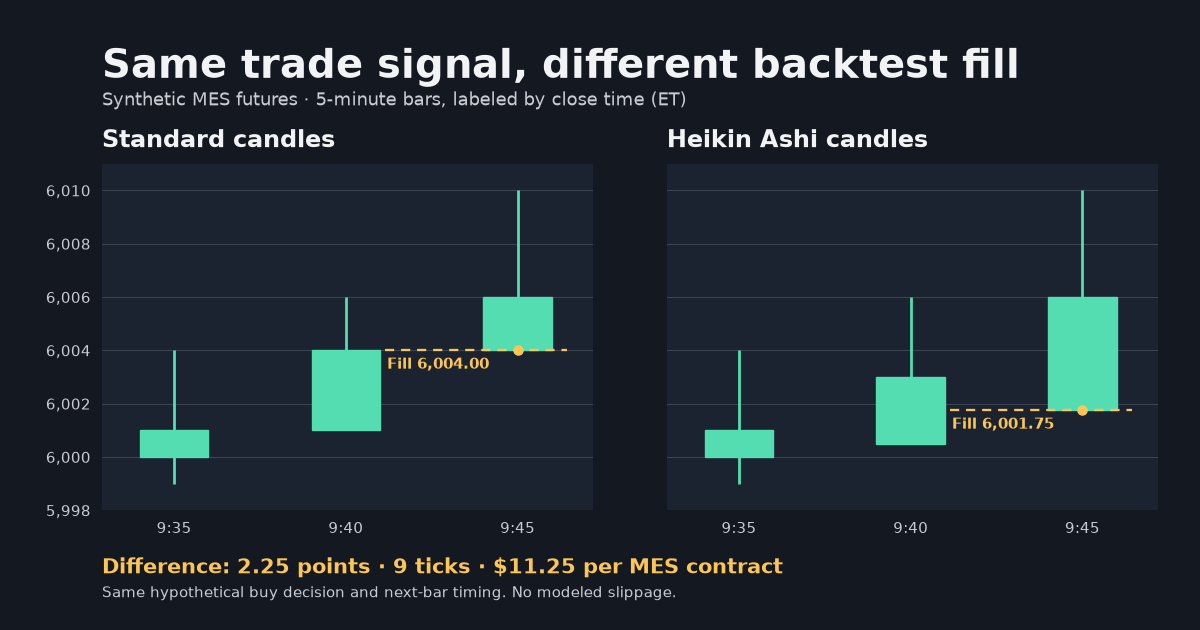
In the chart exercise, hold the buy decision fixed to isolate the fill model. The Heikin Ashi series starts with an assumed previous open and close of 6,000.00. Assume a market entry on the next bar’s open and no modeled slippage. The standard candle ending at 9:45 opens at 6,004.00. Heikin Ashi takes its open from the previous Heikin Ashi open and close. Here 6,000.50 and 6,003.00 average to 6,001.75. That synthetic price is nine MES ticks, or $11.25 per contract, below the standard open.
To compare the fill models on a Heikin Ashi chart, open the strategy’s Settings → Properties and select Standard bars under Heikin Ashi mode. Older help calls this Using standard OHLC. Keep the symbol, dates and other settings fixed, then compare the simulated entry price in Trades. The candle marked Fill bar is labeled by its close time. In this example its modeled entry is at the bar’s open.
Standard bars changes which prices the emulator uses for fills. A script reading Heikin Ashi chart data can still calculate its signals from those transformed values. For a second comparison, switch the whole chart to standard candles and check whether the signals themselves change. Review the realized execution separately if you compare with broker fills.
Open the strategy’s Settings → Properties → Script execution. On realtime bar tick corresponds to calc_on_every_tick in Pine. Older help calls it On every tick. With it enabled, a strategy can recalculate on live updates before the chart bar closes. After reload, the elapsed bars are historical and do not preserve the earlier live updates.
The rule in the chart below checks the current close strictly above 6,001.00. The same finished candle has a high of 6,002.00 and a close of 6,000.50 in all three views. For the close-only view, both On history bar tick and On order fill are off.
On history bar tick can run the script on modeled historical updates for eligible plans and standard charts. Default Bar detalization uses an assumed OHLC path. High detail can use available lower-timeframe data. Neither recreates the original live feed. TradingView also documents that barstate.isconfirmed stays true during these historical intrabar calculations, so it alone does not enforce a close-only test in this mode.
Audit On order fill separately from Order execution delay. One controls additional recalculations after simulated fills. The other controls when orders created on a closing tick can first fill. For a controlled check, record the dated contract, interval, script version, Properties settings and simulation or notification timestamp before refreshing. After that bar closes, reload and compare the same bar and Strategy Report entry. If an alert is involved, check Alerts Log and the saved alert inputs.
Synthetic MES 5-minute candles. Times are bar closes in ET.
At a fictional update at 9:42 ET, the developing candle’s close is 6,001.50. The strict close-above-6,001.00 check is true at that update. The marker sits on the bar ending at 9:45, not at the minute of the update.
In Trades, pick an entry and exit. Record the type, time, fill price, quantity and net result. Compare the multiplier and tick conversion against the product spec. If your report differs from your hand calculation, check the order type, modeled fill timing, price and commissions before changing the strategy rules.
Run the same dates again with one added cost or a different fill-detail setting. Compare trade count, net P&L and drawdown and inspect individual trades that changed. Then keep the chosen assumptions fixed while checking a separate period. A historical backtest is a simulation and can miss live liquidity, gaps and variability in execution.
Platform details on this page were checked against these official resources.
Measure the worst and best price moves during the trade using a worked MES chart.
Check the Strategy Analyzer’s touch setting and the default trade-through rule.
Check the simulated move and tick value for MES, MNQ, ES or NQ.
Compare the results of closed trades on the same cost basis.
Define which decisions are mechanical and which depend on judgment.
Match the signal close, strategy alert price, and broker execution record.
Advance one bar at a time to audit when the rules qualified.
TradingView calls it Strategy Report. It opens below Supercharts after you add a strategy. Open Trades to review individual simulated orders.
TradingView replaced the former checkbox with the Bar detalization menu. Look in the strategy’s Properties or at the top of Strategy Report.
Yes. On a Heikin Ashi chart, select Standard bars in the strategy’s Heikin Ashi mode setting under Properties. It changes the simulated fill prices. A script reading the transformed chart can still use that data for its signals.
The input uses ticks for simulated market and stop fills. One MES tick is 0.25 index points or $1.25 per contract.
Bar detalization provides modeled historical price detail. On history bar tick can expose that detail to the script, but the available history does not restore the original updates that On realtime bar tick saw.
Futures trading contains substantial risk and is not suitable for every investor. TradeReign is a trading-discipline and rule-enforcement application. It does not provide trading advice, trade signals, investment recommendations, or performance guarantees.
TradeReign is not a broker-dealer, futures commission merchant, or investment advisor.
Futures trading contains substantial risk and is not for every investor. An investor could potentially lose all or more than the initial investment. Only risk capital - money that can be lost without jeopardizing financial security or lifestyle - should be used for trading. Past performance is not necessarily indicative of future results.