NYSE participation
Compare the number of advancing stocks with the volume trading in those names.

Compare the number of advancing stocks with the volume trading in those names.
Check the direction of the most recent trades across the basket.
Match the completed ES and internals intervals during the cash session.
VOLD is advancing volume minus declining volume. ADD counts advancing issues minus declining issues relative to their prior close. TICK is a snapshot of how many more stocks are ticking up than down. An individual TICK reading and the session’s buildup in VOLD measure different things.
The volume pane here shows a difference in shares. If you want a ratio, chart advancing volume divided by declining volume using both inputs. You cannot recover that ratio from VOLD alone.
| Pane | Series | thinkorswim | TradingView | Sierra Chart |
|---|---|---|---|---|
| Top left | NYSE up volume minus down volume | $VOLD | USI:VOLD | NVOL-NYSE |
| Top right | NYSE advancing minus declining issues | $ADD | USI:ADD | NISS-NYSE |
| Bottom left | NYSE upticking minus downticking issues | $TICK | USI:TICK | TICK-NYSE |
| Bottom right | E-mini S&P 500 futures | /ES or dated ES | CME_MINI:ES1! or dated ES | Dated ES from your service |
Open Charts. Use the Grid button in the upper right and select two columns by two rows. Click each symbol field and enter the four symbols above. Use independent symbol links if you use a linked watchlist elsewhere, so a watchlist click does not overwrite your internal panes.
Set the time aggregation on each cell to five minutes as a starting point and zoom to the same interval after the U.S. equity open. Consider showing zero on the three internals so changes in sign are visible. Click Grid → Save grid as and name the layout. Use Charts → Flexible Grid if you prefer different pane sizes.
For an exact contract comparison, select the dated ES expiry in symbol search. Before saving, check the instrument descriptions and confirm which contract each platform is displaying around rollover.
In Supercharts, select Layout setup and choose a 2×2 layout. The number of charts available depends on your subscription. Turn off Symbol sync, including any same-symbol sync group on these panes. Set Interval sync if you want a shared five-minute aggregation, and use crosshair sync to compare the same timestamp.
Click each pane before entering its symbol. Select the USI result for each NYSE internal and the CME E-mini S&P 500 result for ES. CME_MINI:ES1! is a continuous chart. Choose a dated contract when comparing exact prices, or check continuous-contract settings before carrying a level between platforms. Save the layout from the top toolbar.
If you only have one chart per layout, load each instrument in its own window or use a watchlist to switch symbols. Use the same timestamp when you switch. Confirm whether the ES and USI feeds are updating and whether either is delayed. An active ES quote overnight does not make the NYSE panes current.
Open the tastycharts grid from the Desktop platform’s navigation column. Use four panes in a 2×2 grid. In the top-left pane enter $VOLD and in the top-right enter $ADD. In the bottom-left enter $TICK. In the bottom-right search for /ES and select the dated E-mini S&P 500 contract you want to compare. This is the arrangement ShadowTrader describes in its FAQ.
Check the instrument name in each pane. tastytrade lists NYSE, Nasdaq and broader U.S. market indicators, so a similarly named symbol can represent a different basket. Use the same interval across all four panes, then compare the completed readings over the same five-minute window during the U.S. equity session.
If the ES pane updates while the internals stay flat, check the time on each pane and whether the equity market is open. For example, a live 8:45 a.m. ET ES print plus an internal value from yesterday’s close gives you no current cash-session confirmation. After the equity open, check for a fresh completed interval in all three internals before using the reversal or trend-day examples below.
Open a chartbook. Use File → Find Symbol → Market Stats to open intraday charts of NVOL-NYSE, NISS-NYSE, and TICK-NYSE. Use the raw NISS symbol for the current difference in issues. Sierra’s Advance Decline Line study adds a different cumulative calculation.
Open a dated CME ES chart from your service. With all four charts attached in the chartbook, choose Window → Tile as Grid - Horizontally. Set a consistent intraday bar period and time zone, then save the chartbook. Verify both the Market Statistics feed and the CME feed from the symbol descriptions and timestamps.
Create a separate workspace and open four windows from Control Center → New → Chart. Start with a dated ES contract and a NYSE TICK chart. For the NinjaTrader Brokerage feed, check access to the Dow Jones & Key Indices data package and enter ^TICK in the Data Series instrument field, including the caret. Arrange the windows in a 2×2 grid and leave Instrument Link off so each chart keeps its symbol.
For the top two panes, use a provider’s chartable net series or a spread indicator that computes the difference between the two inputs in the table. Use matching timestamps and the same exchange universe. For example, if ^ADV reads 1,480 and ^DECL reads 1,320 at the same five-minute close, ADD is +160. For a historical spread chart, plot matched closes as a line. Subtracting two bar highs can pair observations made at different moments. ^TRIN measures a ratio and answers a different question.
IQFeed’s codes below are provider symbols. Check Control Center → Tools → Instruments for an existing instrument and its Symbol Map before adding one, and confirm that your subscription covers the exact series. With multiple connections, review the preferred real-time and historical providers for indexes and futures under Tools → Settings → Market data. A preferred provider may support indexes generally and still lack an individual series.
Set all four charts to the same interval and verify fresh timestamps during the U.S. equity session before saving through Workspaces. If your NinjaTrader connection supplies CME futures only, keep ES and order entry in NinjaTrader and open the three NYSE charts in TradingView or Sierra Chart. Compare the charts at the same time and use the same dated ES contract when you display price on both platforms.
| Pane | NinjaTrader Brokerage | IQFeed provider symbol |
|---|---|---|
| Top left · VOLD | Subtract ^DVOL from ^UVOL | JVNT.Z · NYSE Net Volume |
| Top right · ADD | Subtract ^DECL from ^ADV | JINT.Z · NYSE Net Issues |
| Bottom left · TICK | ^TICK | JTNT.Z · NYSE Net Tick |
| Bottom right · ES | Dated CME ES contract | Dated CME ES contract |
If your data feed supplies the separate NYSE series, the NinjaTrader Ecosystem lists a community indicator named Spread that can subtract one instrument from another. Confirm that all four source symbols update on their own before setting it up. To use the add-on, download it from the source below and open Control Center → Tools → Import → NinjaScript Add-On.
Open the primary chart in the table on a five-minute interval. In the chart’s Indicators window, add Spread and set Symbol2 to the secondary symbol. Set Qty1 to 1, Qty2 to −1, and disable UseMultiplier to keep the calculation in stocks or shares. Choose On bar close and display the Spread line in its own panel. Repeat for the other pane.
The check values below are fictional readings at 10:05 a.m. ET. In your workspace, choose a completed five-minute bar during the cash session and subtract the two source closes at that timestamp. Compare the result with the plotted value. If a source is missing or stale, check its entitlement, connection and timestamps before interpreting the line. If the raw closes and the Spread result disagree, verify the secondary series and bar alignment or use your provider’s direct net series.
| Net series | Primary chart | Symbol2 | Fictional result |
|---|---|---|---|
| ADD | ^ADV | ^DECL | +160 stocks (1,480 − 1,320) |
| VOLD | ^UVOL | ^DVOL | +25 million shares (185M − 160M) |
During the U.S. equity session, check the latest completed interval in each pane. Match the actual time span in one time zone. For a five-minute interval from 10:10 to 10:15 a.m. ET, a TradingView bar is labeled by its 10:10 start. NinjaTrader Desktop stamps that interval with its 10:15 end. Both can describe the same five minutes.
Then check when each series is actually updating. In TradingView, select each pane and check its status line for Data is delayed. In NinjaTrader, check which provider supplies each instrument and verify access for that symbol. Check ES separately from the NYSE series. A shared crosshair can align the cursor while one pane is still behind.
Suppose shortly after 10:15 ET you see an ES close of 6,012.00 while ADD shows −250 for the last available interval ending at 10:05. Pairing them could make the ES rally look unsupported. In this example, the comparable ES close at 10:05 is 6,004.00. When the ADD value for 10:15 becomes available, it is +320. For a historical read, use the latest interval present in all panes. For a current read, flag a missing or delayed pane and wait to interpret the full Quad until its intervals match.
| Interval ends (ET) | ES close | ADD close |
|---|---|---|
| 10:05 | 6,004.00 | −250 |
| 10:15 | 6,012.00 | +320 when available |
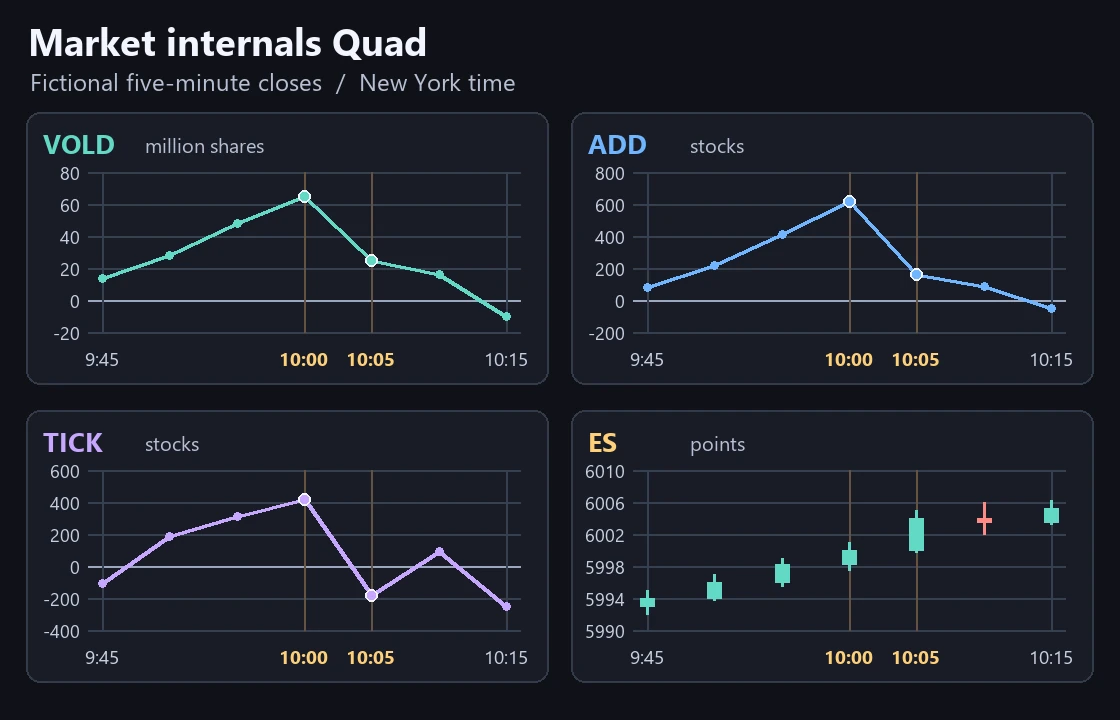
In the fictional snapshots below, ES is four points higher at 10:05 ET. Advancing issues and volume still lead, but both margins narrow. TICK has flipped negative at that moment. This describes weaker NYSE participation during the move. It gives you a question to investigate as the move continues, without establishing that ES will reverse.
Compare the same observation type across time, such as five-minute closes or snapshots taken together. A TICK candle high captures an intrabar extreme, which may already have reversed by the close. Data providers may use different stock universes, update intervals, and volume units. Check those before expecting matching readings across platforms.
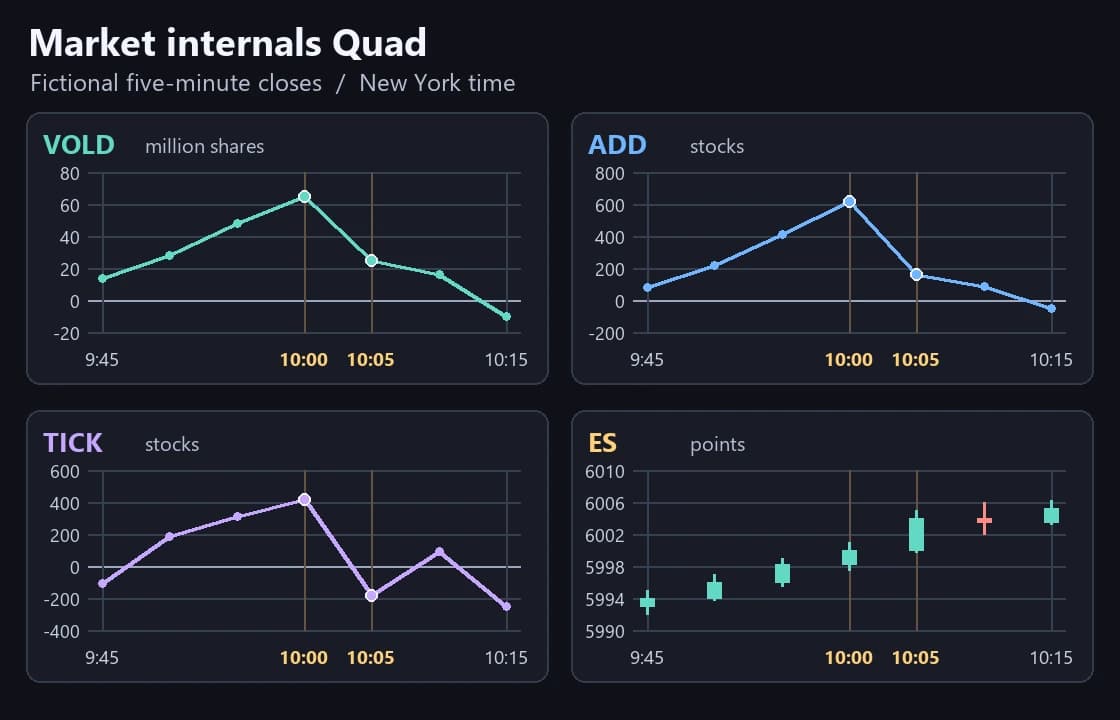
| Series | 10:00 ET | 10:05 ET |
|---|---|---|
| Net advancing volume | +65 million shares | +25 million shares |
| Net advancing issues | +620 stocks | +160 stocks |
| NYSE TICK snapshot | +420 stocks | −180 stocks |
| ES price | 6,000.00 | 6,004.00 |
A deeply negative NYSE TICK reading shows that many more stocks are ticking down than up at that moment. ShadowTrader highlights extreme TICK prints, using +1,000 as an example of widespread program activity. In real time you only know the low so far. A print of −1,120 can precede a bounce or be followed by even lower prints.
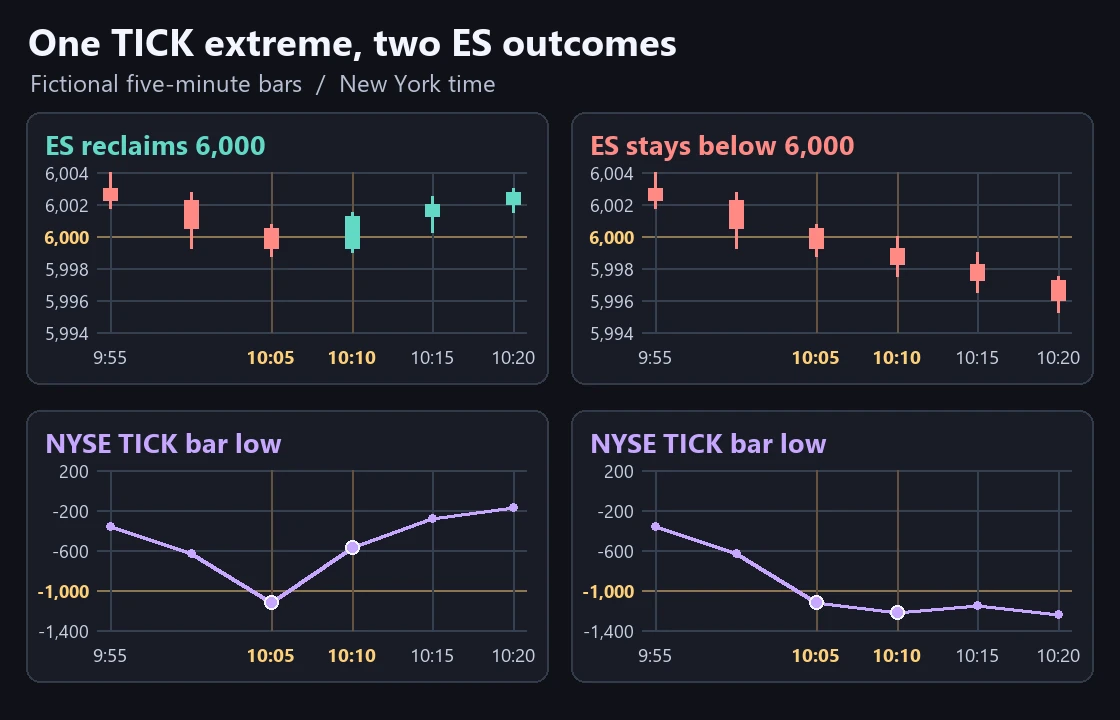
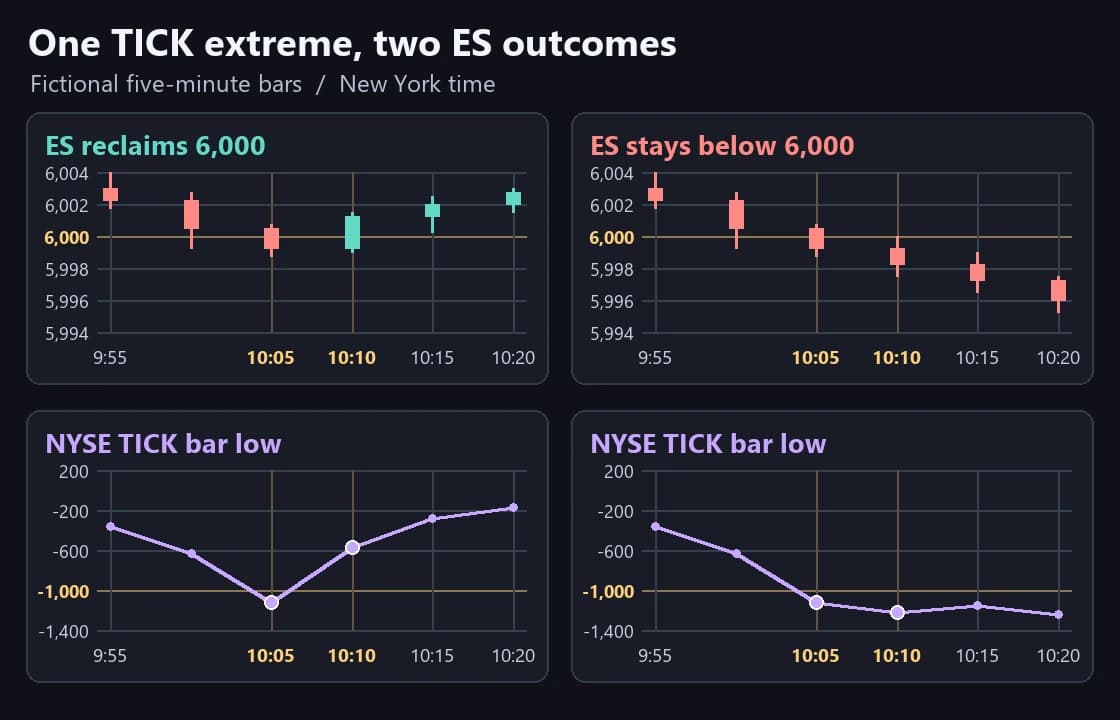
Start with an ES level marked before the move. In these fictional cases, the prior regular-session low is 6,000. At 10:05 a.m. ET, both cases trade to 5,998.75 and TICK reaches −1,120. In the first case, the next five-minute bar closes back above 6,000 at 6,001.25. Its TICK low is less negative, ADD and VOLD improve, and the ES reclaim bar trades 11,000 contracts versus an 8,000-contract median over the previous six bars. That volume makes the reclaim worth investigating. The close and a subsequent hold above 6,000 give you price confirmation.
In a replay drill, mark the first eligible observation at the 10:10 close if your rule requires a reclaim, or after the 10:15 retest if your rule also requires a hold. If the first available fill after the 10:10 close is 6,001.50 and the hypothetical stop is 5,998.50, one futures tick below the sweep low, the planned price risk is 3 points per contract before fees and slippage. Higher ES volume shows more trading activity. A busy bar that closes below support still fails this reclaim rule.
In the second case, ES fails to close back above 6,000 and the internals worsen. ShadowTrader’s Iceberg Tick emphasizes how long readings stay on one side of zero. In replay, keep watching completed raw TICK closes after the extreme. A series of negative closes during failed ES bounces supports the continuation read. A move back toward zero alongside a price reclaim gives you a reason to revisit it.
| Observation | Reclaim case | Continuation case |
|---|---|---|
| 10:05 ET · ES low / TICK low | 5,998.75 / −1,120 | 5,998.75 / −1,120 |
| 10:10 ET · ES close / TICK low | 6,001.25 / −570 | 5,998.25 / −1,220 |
| 10:05 → 10:10 ET · ADD | −700 → −380 | −2,030 → −2,100 |
| 10:05 → 10:10 ET · VOLD | −90M → −63M shares | −280M → −320M shares |
Start with the same NYSE data series and cash-session window each time. If your drill tags the first completed five-minute bar with a TICK low at or below −1,000, log it at that bar’s close. Use the TICK low field for the extreme and the ES close to check the separate price confirmation. A rule based on real-time TICK updates would need the intrabar timestamps instead.
Suppose the 9:55 bar reaches −980, the 10:05 bar reaches −1,120, and the 10:35 bar reaches −1,340. If no earlier bar had a low at or below −1,000, the first threshold event stays at 10:05 even though 10:35 sets a lower reading. Label −1,120 the session low so far at that moment. When you review the whole session, the final low belongs in a separate field.
Decide in advance whether to score the first event only or each new extreme. Within that same rule, keep sessions with no qualifying print, failed ES reclaims, and missing TICK history visible in the log. Those cases help you tell whether the threshold found usable decisions or simply highlighted the largest moves in hindsight.
ADD counts how many more NYSE issues are advancing than declining. VOLD measures how much more volume has traded in advancing issues than in declining issues. The signs can disagree when more stocks are up on the session but more shares have traded in the group of stocks that is down.
In the fictional example below, ES closes above the prior cash-session high of 6,010 at both 10:05 and 10:10 ET. ADD stays positive, while negative VOLD stretches from 80 million to 120 million shares. The volume pane still shows more trading in declining stocks at both closes.
If your replay rule requires both positive ADD and positive VOLD for volume confirmation, record the 10:10 observation as missing that confirmation. Mark what would change your read, such as VOLD improving while ES holds 6,010 on a retest, or ES closing back below 6,010. Check that the breadth panes use the same NYSE universe and timestamp. A change in session VOLD can also reflect stocks switching from the advancing group to the declining group, so the change alone cannot identify the volume traded in each group during those five minutes.
| Observation | 10:05 ET | 10:10 ET |
|---|---|---|
| Advancing / declining issues | 2,100 / 900 | 2,080 / 920 |
| ADD | +1,200 issues | +1,160 issues |
| Advancing / declining volume | 80M / 160M shares | 100M / 220M shares |
| VOLD | −80M shares | −120M shares |
| ES close | 6,011.25 | 6,014.25 |
Peter Reznicek’s August 29, 2019 premarket note used ADD holding above +1,500 after the first 30 minutes as evidence against fading that morning’s upside gap. His March 25, 2021 note described a downside continuation scenario with ADD near −2,000 and declining volume more than four times advancing volume. He also wanted ES to show little ability to recover the gap. Those are examples tied to their opening conditions and NYSE readings.
In the fictional continuation above, ADD stays below −2,000 across successive readings and VOLD grows more negative as ES fails to reclaim 6,000. At 10:10, 420 million declining shares versus 100 million advancing shares is 4.2:1 down to up, equivalent to −320 million shares in the VOLD pane. You need the two underlying volumes to compute that ratio. Here the breadth supports caution with countertrend longs. Watch whether ES holds below the broken level on a retest. If price reclaims it and breadth moves toward zero, reassess the continuation idea.
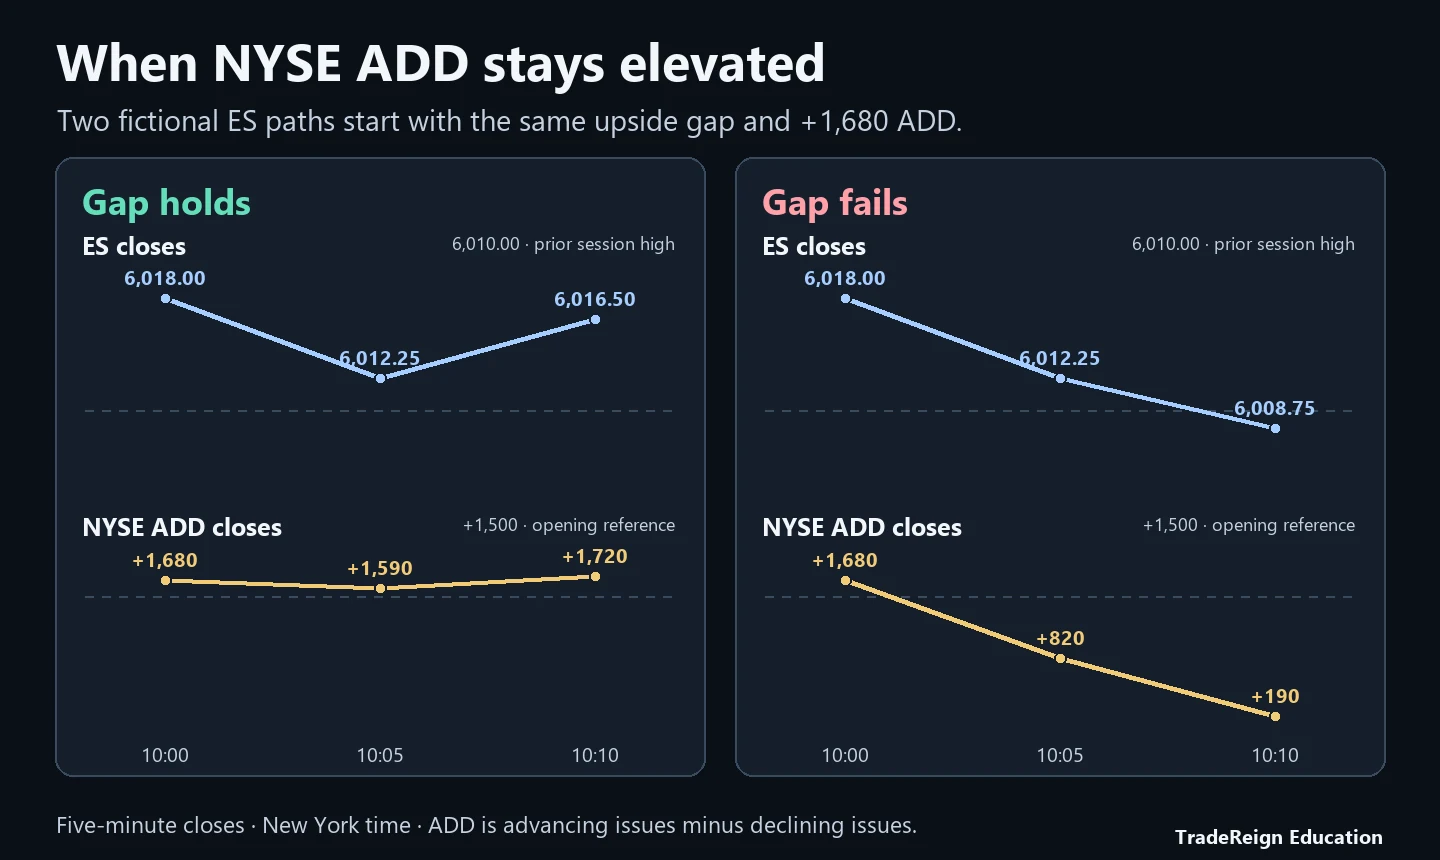
For an upside gap, start with the prior regular-session high. In both fictional paths below, that high is 6,010. By 10:00 ET, 30 minutes into the cash session, ES is above it and ADD is +1,680. In the first path, ES holds the prior high on the pullback, ADD stays above +1,500 at the next two closes, and VOLD grows from +190 to +230 million shares on the bounce. A replay continuation rule could wait for ES to break the bounce bar’s high while breadth stays firm. In the second path, ADD falls toward zero and ES closes back inside the prior range. The opening reading has lost its confirmation.
Use the +1,500 and −2,000 readings as references for the opening scenarios Reznicek described. To compare sessions, use the same NYSE feed, cash-session clock and bar interval. Log how long ADD stays stretched and whether ES holds outside the prior range. You can then check whether the same evidence was present on the days that reversed.
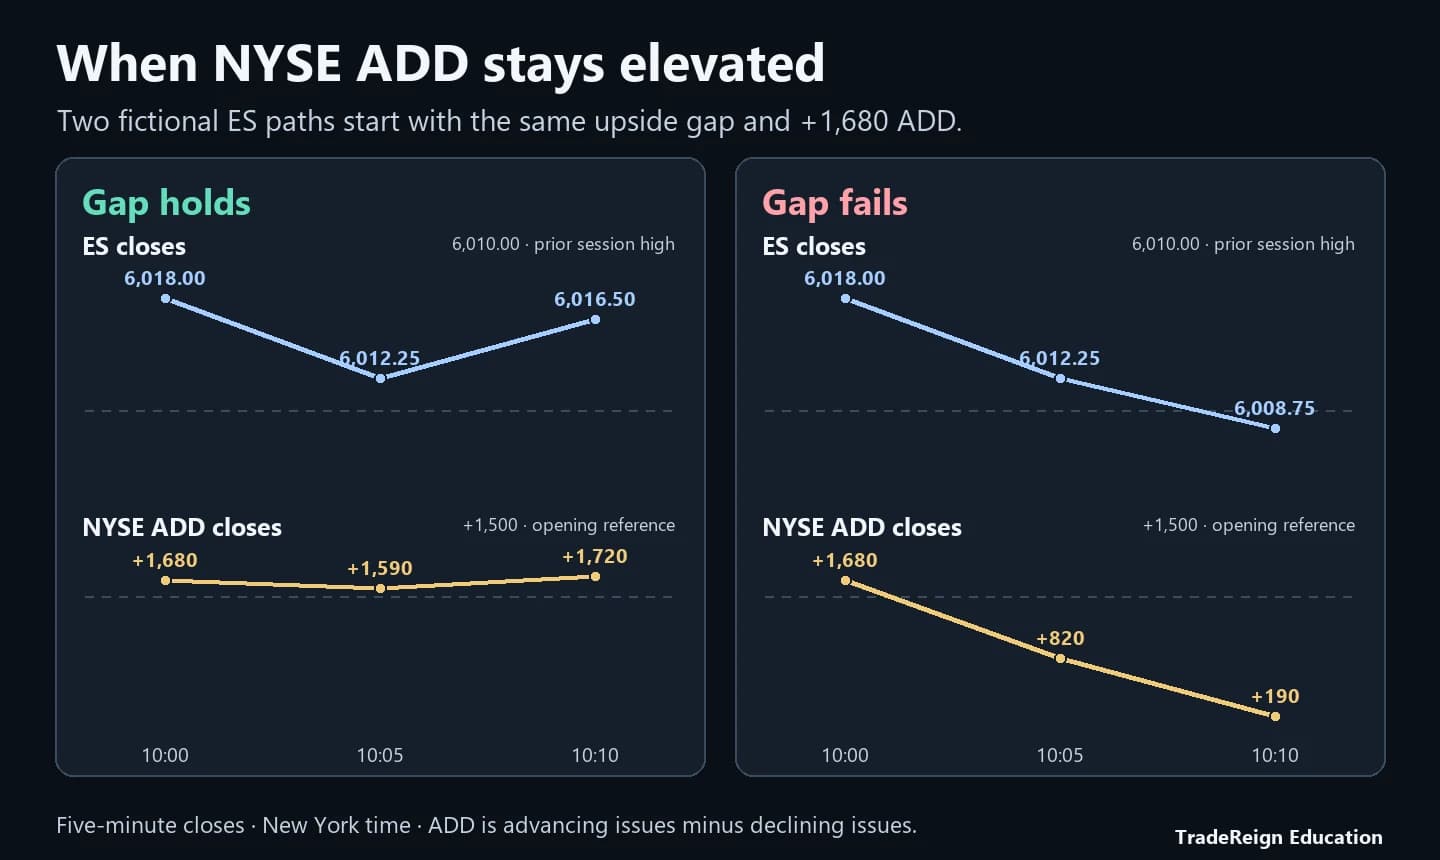
Both ES paths close at 6,012.25 at 10:05 a.m. New York time. The ADD readings already differ. At 10:10 only the second ES path closes back inside the prior range.
Open the full-size ADD comparison| Time ET | Gap holds · ES close / ADD | Gap fails · ES close / ADD |
|---|---|---|
| 10:00 ET | 6,018.00 / +1,680 | 6,018.00 / +1,680 |
| 10:05 ET · pullback | 6,012.25 / +1,590 | 6,012.25 / +820 |
| 10:10 ET · next close | 6,016.50 / +1,720 | 6,008.75 / +190 |
Continue the fictional downside case. At 10:10 ET, ES has just closed at 5,998.25 below the prior cash-session low of 6,000.00. ADD is −2,100 and the down-to-up volume ratio is 4.2:1. Suppose the retest bar reached 5,999.75 and traded as low as 5,998.00. The breadth readings set the context. The price sequence decides what happens next.
For this drill, after the 10:10 close, watch for a trade at 5,997.75, one tick below the retest low. Cancel the planned entry for this setup if ES trades at 6,000.00 first. If the short fills first, 6,000.00 is the protective stop in the exercise. A fill at both marked prices would lose nine ticks, or $112.50 per ES contract before fees and slippage.
Both paths produce the same five-minute open, high, low and close. One triggers the short and then hits the stop. The other cancels the setup before a short can trigger. In replay, use lower-interval bars or timestamped trades to establish the order. If the finer data still places both events in one unresolved interval, mark the sequence unknown. Keep the 10:10 breadth readings fixed and use actual order records to score real fills.
| Time ET | Entry first | Cancel first |
|---|---|---|
| 10:10 | Opens at 5,998.25 | Opens at 5,998.25 |
| 10:11 | Trades at 5,997.75 and triggers the short | Trades at 6,000.00 and cancels the setup |
| 10:12 | Trades at 6,000.00 and triggers the stop, then reaches 6,000.25 | Trades down to 5,997.75 after reaching 6,000.25 |
| By 10:15 | Low 5,996.75, close 5,997.50 | Low 5,996.75, close 5,997.50 |
| Replay log | Stopped out under the assumed fills | No trade |
A VOLD reading of −320 million shares gives the difference between advancing and declining volume. It can describe both snapshots below. In the first, 420 ÷ 100 gives 4.2:1 down to up. In the second, 720 ÷ 400 gives 1.8:1. Only the first exceeds the 4:1 threshold in Reznicek’s March 25 example. You still need the ADD and price checks from that scenario.
To reproduce the comparison in TradingView, open USI:UVOL and USI:DVOL on the same interval and read their closes at the same cash-session timestamp. Divide declining volume by advancing volume for a down-to-up reading. TradingView also documents division in Symbol Search. Where both inputs are available, enter USI:DVOL / USI:UVOL and check its line value against the two input closes. If TradingView switches the spread to Daily and prompts for an upgrade, use the two separate intraday input charts where available. Use the same exchange, session, and bar times when comparing readings.
Check which volume is in the numerator. A chart using up divided by down shows about 0.24 for the first snapshot, which represents the same imbalance as 4.2:1 down to up. If an input is missing, delayed relative to the other, or the denominator is zero, leave the ratio blank in your replay notes. TradingView explains that its live and historical spread bars can differ, so record the actual observed reading if you are reviewing a live decision later.
| Measure | First | Second |
|---|---|---|
| UVOL | 100M shares | 400M shares |
| DVOL | 420M shares | 720M shares |
| VOLD | −320M shares | −320M shares |
| Down ÷ up | 4.2:1 | 1.8:1 |
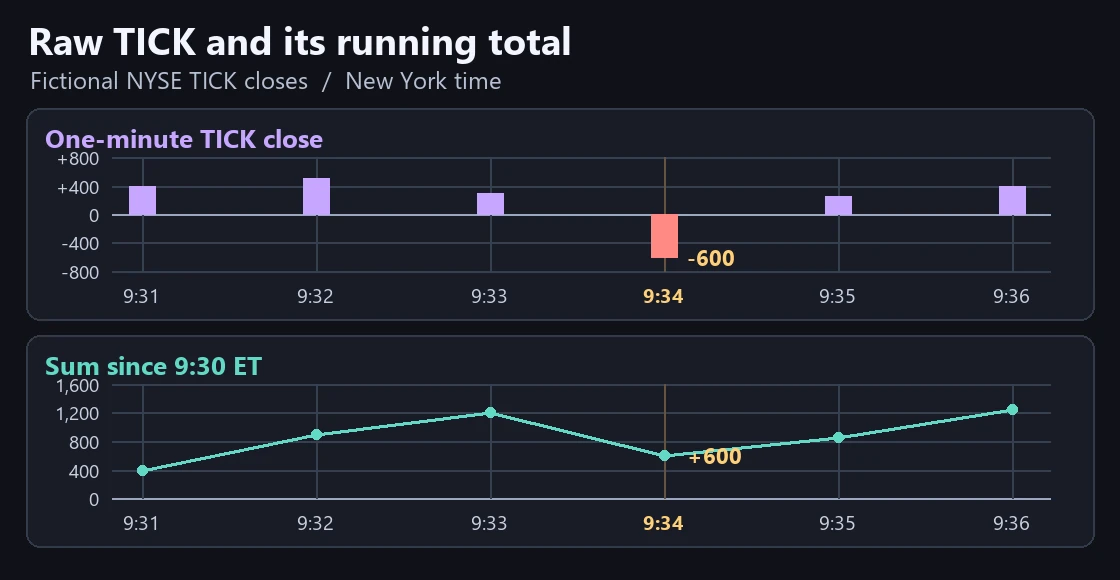
Raw NYSE TICK is a snapshot of upticking stocks minus downticking stocks. Cumulative TICK tracks a running balance of sampled TICK values over a window. It can stay positive while the latest raw print is deeply negative. At 9:34 ET in this fictional example, −600 reduces the running total from +1,200 to +600.
This chart resets to zero at 9:30 ET and adds each completed one-minute TICK close. Some indicators use a different bar value, subtract a baseline or restart at another session boundary. A one-minute sum also has more observations than a five-minute sum. Compare the exchange, aggregation, input and reset before comparing two readings or applying a threshold from a raw TICK chart.
ShadowTrader documents an optional Cumulative Tick add-on for NinjaTrader that plots a running total. The chart here illustrates one calculation with synthetic data. For your workspace, keep the raw TICK pane available for the momentary reading and check the documentation for the cumulative study you add. Read the slope and the latest raw print alongside price, ADD and VOLD.
Cumulative volume delta adds signed trade volume for a specific instrument such as ES. Cumulative TICK starts with a count of stocks across an exchange. On the same five-minute ES bar, those readings can point in different directions.
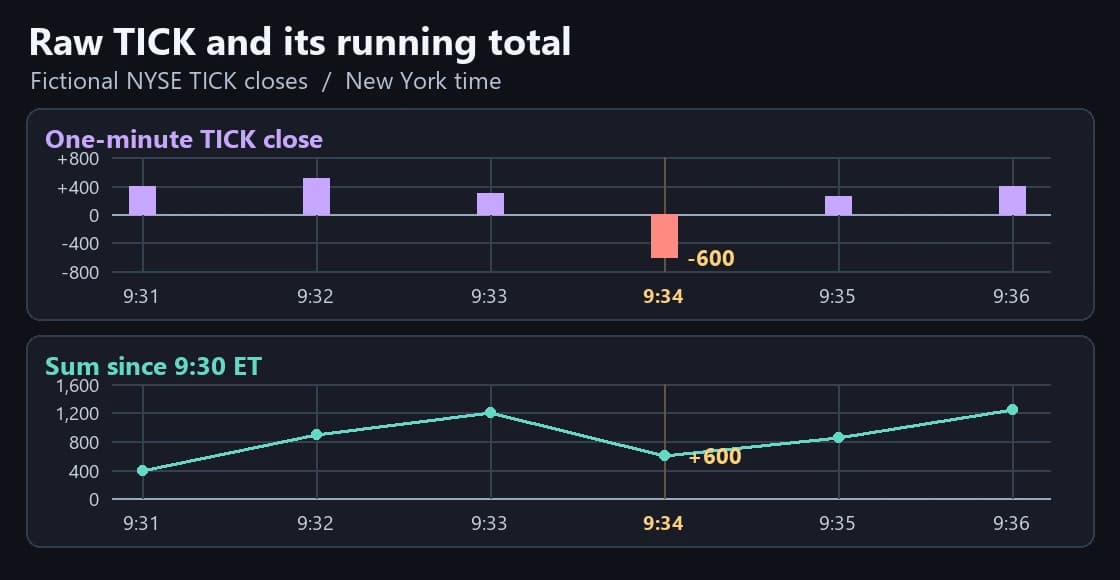
| Time ET | Raw NYSE TICK | Running total |
|---|---|---|
| 9:31 | +400 | +400 |
| 9:32 | +500 | +900 |
| 9:33 | +300 | +1,200 |
| 9:34 | −600 | +600 |
| 9:35 | +250 | +850 |
| 9:36 | +400 | +1,250 |
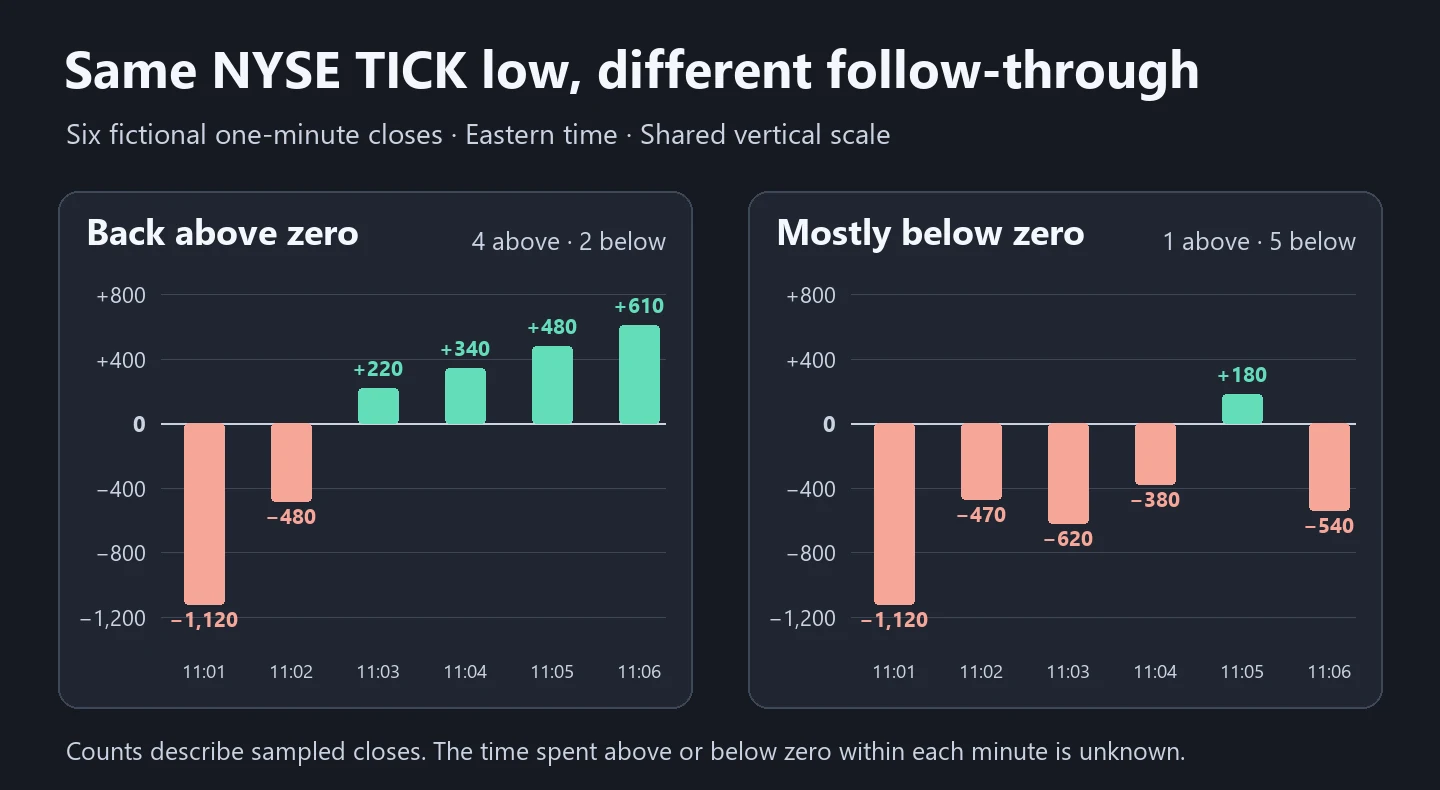
ShadowTrader’s Iceberg Tick emphasizes how long TICK stays above or below zero. If your chart only gives you completed minute bars, count the positive, negative, and zero closes over a window you chose beforehand. A close is one observation. It does not tell you how much of that minute TICK spent on either side of zero. Keep missing observations visible and use the same feed and interval for comparisons.
Both fictional sequences start at −1,120. In the first, all four closes from 11:03 through 11:06 ET are above zero. In the second, the only positive close is at 11:05 and the 11:06 close is negative again. A positive print by itself would have looked more encouraging at 11:05 than the six-close sequence does a minute later.
At the end of a replay window, compare ES to a price level you marked before the move. If ES reclaims that level and ADD and VOLD improve while TICK is recovering, the readings support watching for a hold. If ES stays below the level and ADD and VOLD remain weak, keep the reversal unconfirmed. Record mixed internals as mixed, even if price later turns. Six samples illustrate the check without setting an entry rule or classifying the whole session.
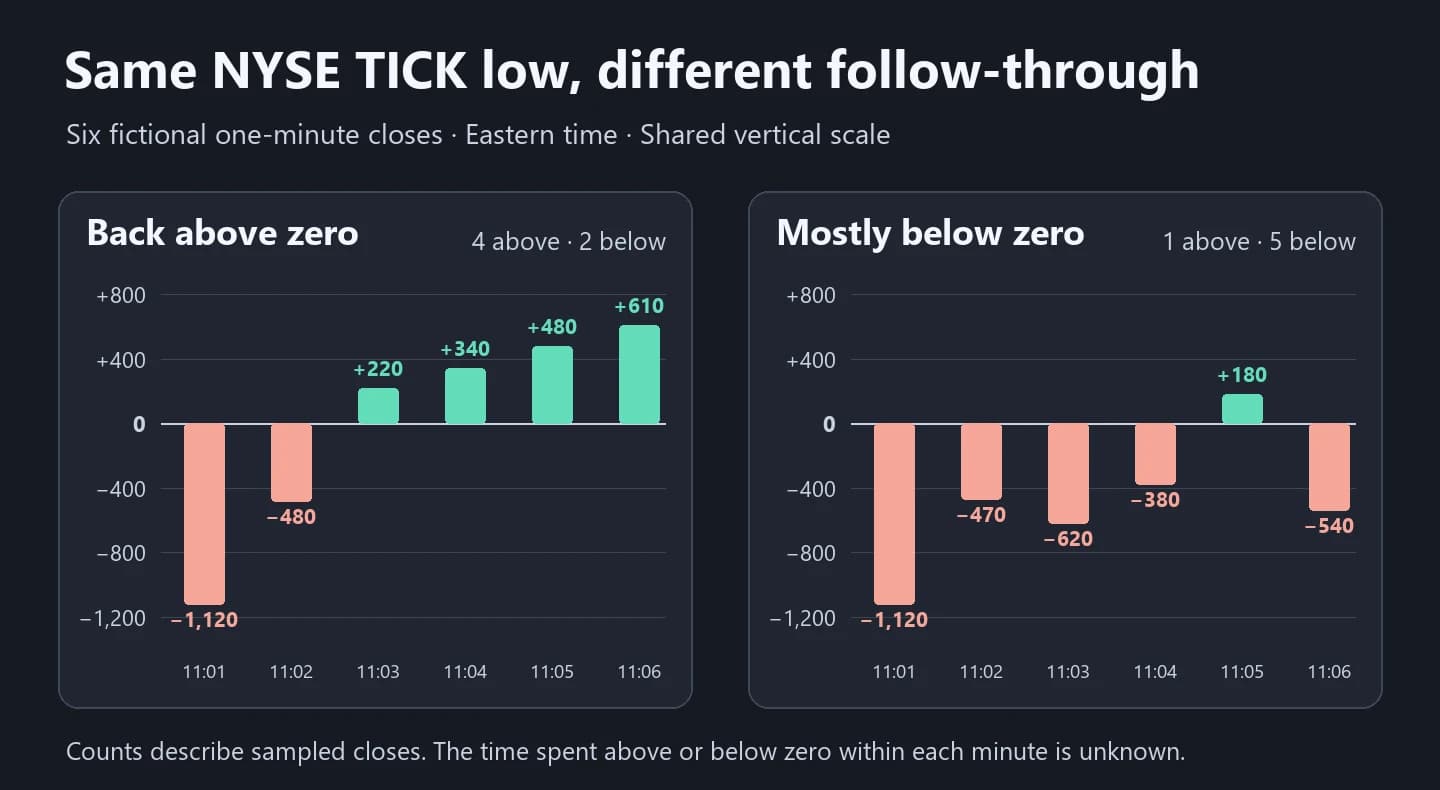
| Time ET | Back above zero | Mostly below zero |
|---|---|---|
| 11:01 | −1,120 | −1,120 |
| 11:02 | −480 | −470 |
| 11:03 | +220 | −620 |
| 11:04 | +340 | −380 |
| 11:05 | +480 | +180 |
| 11:06 | +610 | −540 |
ShadowTrader’s ES Quad uses NYSE TICK, ADD, and VOLD to read participation. To compare Nasdaq futures with Nasdaq exchange breadth in TradingView, copy the layout and use USI:VOLDQ, USI:ADDQ, USI:TICKQ, and a dated NQ or MNQ chart. Keep Symbol sync off. TradingView labels TICKQ as Nasdaq Combined TICK. These series describe a Nasdaq stock universe. The Nasdaq-100 that underlies NQ and MNQ tracks a narrower, weighted group of large non-financial companies.
Compare completed bars in the same U.S. cash session. In this example a range high of 20,200 is marked in advance. At 10:05 ET, MNQ closes above it at 20,208 while Nasdaq TICK falls from +480 to −110, and Nasdaq ADD and VOLD both weaken. NYSE TICK, ADD and VOLD strengthen at that same close. The two exchanges are giving different readings, and the MNQ breakout is still above the marked price at that point.
For this replay exercise, a close back below 20,200 is the first evidence that the breakout has failed. That arrives at 10:10 when MNQ closes at 20,197. If MNQ instead holds the range high while Nasdaq breadth improves, the failure condition hasn’t occurred. Compare each series with its own earlier readings. Check the timestamps and data status before treating a delayed pane as a divergence.
Synthetic MNQ and Nasdaq TICK 5-minute candles. Times are bar closes in ET.
MNQ closes above 20,200 at 10:05 ET while the Nasdaq TICK close falls below zero. MNQ closes back inside the range at 10:10. The table includes the NYSE and Nasdaq readings at each bar close.
| Series | 10:00 ET | 10:05 ET | 10:10 ET |
|---|---|---|---|
| MNQ price | 20,198.00 | 20,208.00 | 20,197.00 |
| NYSE TICK · ADD · VOLD | +180 · +420 · +55M | +510 · +780 · +92M | +330 · +640 · +86M |
| Nasdaq TICK · ADD · VOLD | +480 · +520 · +70M | −110 · +90 · +35M | −510 · −260 · −12M |
Platform details on this page were checked against these official resources.
Compare recorded closes from the two separate symbols when replay has data for both.
Keep symbols independent when you copy chart settings or indicators.
Use the prior regular-session boundary or close consistently when you assess a gap fill.
Match session, time blocks and price rows on four platforms.
Keep a separate copy of the completed four-chart layout.
Check the first eligible revisit against the cash-session boundary.
Learn to read the shape of a TPO profile separately from NYSE market participation.
Confirm the ES price feed before comparing it with the NYSE panels.
Check the active provider and compare the same contract with a live feed.
Verify the displayed expiry and rollover settings.
Yes. Use a four-chart layout if your subscription supports it. Disable Symbol sync and enter USI:VOLD, USI:ADD, USI:TICK, and an ES futures chart. Separate windows also let you keep the four symbols apart.
Check Symbol sync in Layout setup and individual symbol groups. Keep the symbols independent. Interval and crosshair syncing can remain enabled.
Enter ^TICK for the NinjaTrader Brokerage feed with the Dow Jones & Key Indices package. If you use another feed, check the instrument’s Symbol Map and the provider’s subscription coverage.
Treat a new TICK low as a prompt to check price and breadth. A potential reversal can develop when ES reclaims a premarked level, later TICK lows improve, and ADD or VOLD starts recovering. If ES holds below support while breadth weakens, the long example has no confirmation.
A strongly positive or negative count persists through successive observations. Peter Reznicek used ADD above +1,500 after the first half hour in one upside-gap example and near −2,000 with more than 4:1 downside volume in a downside example. Check whether ES holds outside the prior range and whether volume breadth supports the same direction.
The negative reading reduces the running total. If earlier readings contributed more than that drop, the total stays positive. Check the indicator’s reset and bar input before comparing values.
If your provider supplies TICK, net advancing issues and net advancing volume as chartable series, you can use the platform’s standard charts. When the feed supplies separate inputs, a spread indicator can calculate the two differences.
Futures trading contains substantial risk and is not suitable for every investor. TradeReign is a trading-discipline and rule-enforcement application. It does not provide trading advice, trade signals, investment recommendations, or performance guarantees.
TradeReign is not a broker-dealer, futures commission merchant, or investment advisor.
Futures trading contains substantial risk and is not for every investor. An investor could potentially lose all or more than the initial investment. Only risk capital - money that can be lost without jeopardizing financial security or lifestyle - should be used for trading. Past performance is not necessarily indicative of future results.