Time blocks
Compare the actual start and end times, since platforms label blocks differently.

| Price | Periods | TPO count | Volume | Level |
|---|---|---|---|---|
| 6,001.00 | 1 | 20 | ||
| 6,000.75 | 1 | 70 | ||
| 6,000.50 | 4 | 180 | TPO POC | |
| 6,000.25 | 3 | 110 | ||
| 6,000.00 | 2 | 240 | Volume POC |
Compare the actual start and end times, since platforms label blocks differently.
Use one tick per row to audit a short example before combining prices.
Check whether a displayed level comes from time blocks or traded contracts.
For numbered time blocks, choose the Monkey Bars chart mode and set a 30-minute time aggregation. Schwab labels the first block 1 and the next 2. Appearance Settings controls the row height and display. The Monkey Bar is the time-based point of control and the Playground is the surrounding value area.
To see a time histogram next to price candles, add TPOProfile from Studies. Set Price per row height mode to TICKSIZE, Time per profile to DAY and Multiplier to 1. Turn off On expansion to show several historical profiles, and enable Show point of control and Show value area. Confirm the first and last bars included in each profile before calling it a cash-session profile.
In Supercharts, select the Time price opportunity chart type. In Chart Settings, set Periods to one day and Block size to 30 minutes. Use manual Row size and set Ticks per row to 1. Turn on POC, VAH and VAL under Lines and labels. One-day profiles also support session selection. Use Custom if you need the same exact start and end times as another chart.
Turn on Show volume profile if you want the contract-volume distribution alongside the letters. You can toggle POC separately for the two profiles. With the same one-tick rows, the two POCs in the example still differ because each counts a different measure.
For a recurring day and overnight split, use a one-day TPO chart and choose the session intervals in Chart Settings → Symbol → Session. For a one-off study, right-click the letter where the new profile should start and choose Split profile at this letter. In the fictional profile above, splitting at C starts the second profile at 10:30 a.m. ET.
In the combined profile, 6,000.50 has all four letters. After the split, the first portion has three rows tied at two TPOs each. The second portion has two TPOs at 6,000.50 and one at each of the other traded rows. A split changes which blocks can contribute to each profile’s POC and value area, while the underlying trades stay the same.
To combine the two portions, right-click the later profile and choose Merge with previous profile. Reset all merges and splits restores the original grouping. Record the contract, time window and split boundary before taking a screenshot or logging a level.
| Price | Combined | 9:30–10:30 | 10:30–11:30 |
|---|---|---|---|
| 6,001.00 | — | ||
| 6,000.75 | — | ||
| 6,000.50 | |||
| 6,000.25 | |||
| 6,000.00 | — |
In Lines & labels, enable extending the level you want to monitor, such as POC or VAH. Open the alert dialog and choose the corresponding crossing condition. TradingView uses completed profiles for these alerts. A level from the still-forming profile can appear on the chart before it is eligible for the alert.
TradingView saves the profile settings when you create the alert. A later split or merge does not update that saved alert. After changing the profile, check the new completed levels, replace the old alert if you want the new settings, and review the next alert log entry against the profile you meant to watch.
Open an intraday chart, check the Trading Hours template in Data Series, and add the Order Flow Volume Profile indicator where Order Flow+ is available. Choose Price profile, a repeating Sessions period of one session, and Ticks per level of 1. Letters can display as blocks when there is too little room. Expand the chart to read the letters.
NinjaTrader Desktop assigns its letters to fixed 30-minute time windows. Its A starts at 8:00 a.m. CT, so 9:30–10:00 a.m. ET is B. On a profile whose first period starts at 9:30 ET, the same block can be A, or 1 in Monkey Bars. Compare time windows in the indicator’s Times settings before interpreting letter differences.
Open the Chart (NinjaTrader) widget and choose TPO from the chart-style dropdown. To set up the profile, use Edit chart elements on the left toolbar and choose the instrument to open its Data series properties. This is NinjaTrader Web’s native chart. The TradingView chart widget inside NinjaTrader Web has a different list of styles.
Set the box size in ticks and the start and end times for your chosen session. NinjaTrader Web supports separate sessions, splits and merges. Hover over a profile header or letter to check which time window it represents. If you also display a volume profile, confirm which POC and value area you are reading before recording the levels.
Open the dated contract on an intraday chart and add the TPO Profile Chart study from Analysis → Studies. Set the Letter/Block Price Increment in Ticks to 1, the profile length to one day, and the TPO Letter/Block period to 30 minutes. Check Chart Settings → Session Times and how the study handles the evening session.
Check Highlight TPO POC and Highlight TPO Value Area when you want time-based levels. Sierra also offers volume-based highlighting on a TPO chart. Verify those settings and the row-count method before comparing VAH and VAL with another platform.
ShadowTrader describes a 45-degree line from the low of a distribution to its widest TPO row. Start with a left-aligned TPO profile and count letters. Zoom and aspect ratio can change the visible angle. Use the TPO point of control as the upper endpoint, even if the volume point of control is at a different price.
The two fictional ES profiles below share the same low, 5,999.75, and TPO point of control, 6,000.50. From low to POC, the first has widths of 1, 2, 3 and 4 letters. In the second profile, period C also reaches 6,000.00, giving widths of 1, 3, 3 and 4. A line drawn between the endpoints is identical. The rows between those endpoints distinguish the two profiles.
For this replay drill, require exactly one more letter at each successive row from the low to the TPO POC. That is a scoring convention for this exercise. Freeze the chosen profile window, time blocks and row size before scoring. If you change the settings, record the new view separately.
ShadowTrader watches the low as a reference for a potential reversal. In replay, log whether the next regular session trades below the old low, reclaims it, or stays above it. Keep those observations separate from the shape classification. A profile shape describes where price traded during its time blocks. The example gives no estimate of reversal odds.
| Price | Even steps | Uneven steps |
|---|---|---|
| 6,001.25 | ||
| 6,001.00 | ||
| 6,000.75 | ||
| 6,000.50 | ||
| 6,000.25 | ||
| 6,000.00 | ||
| 5,999.75 |
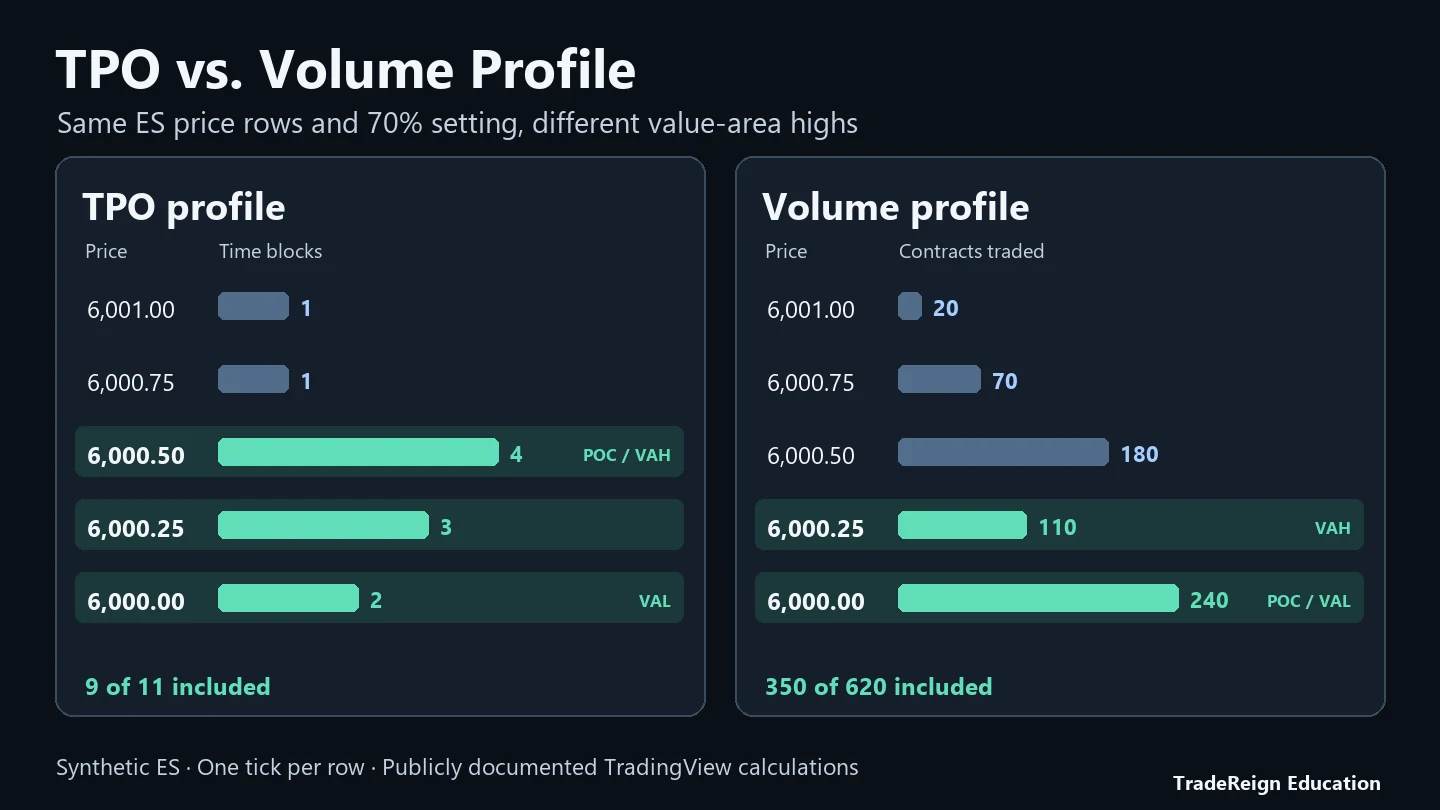
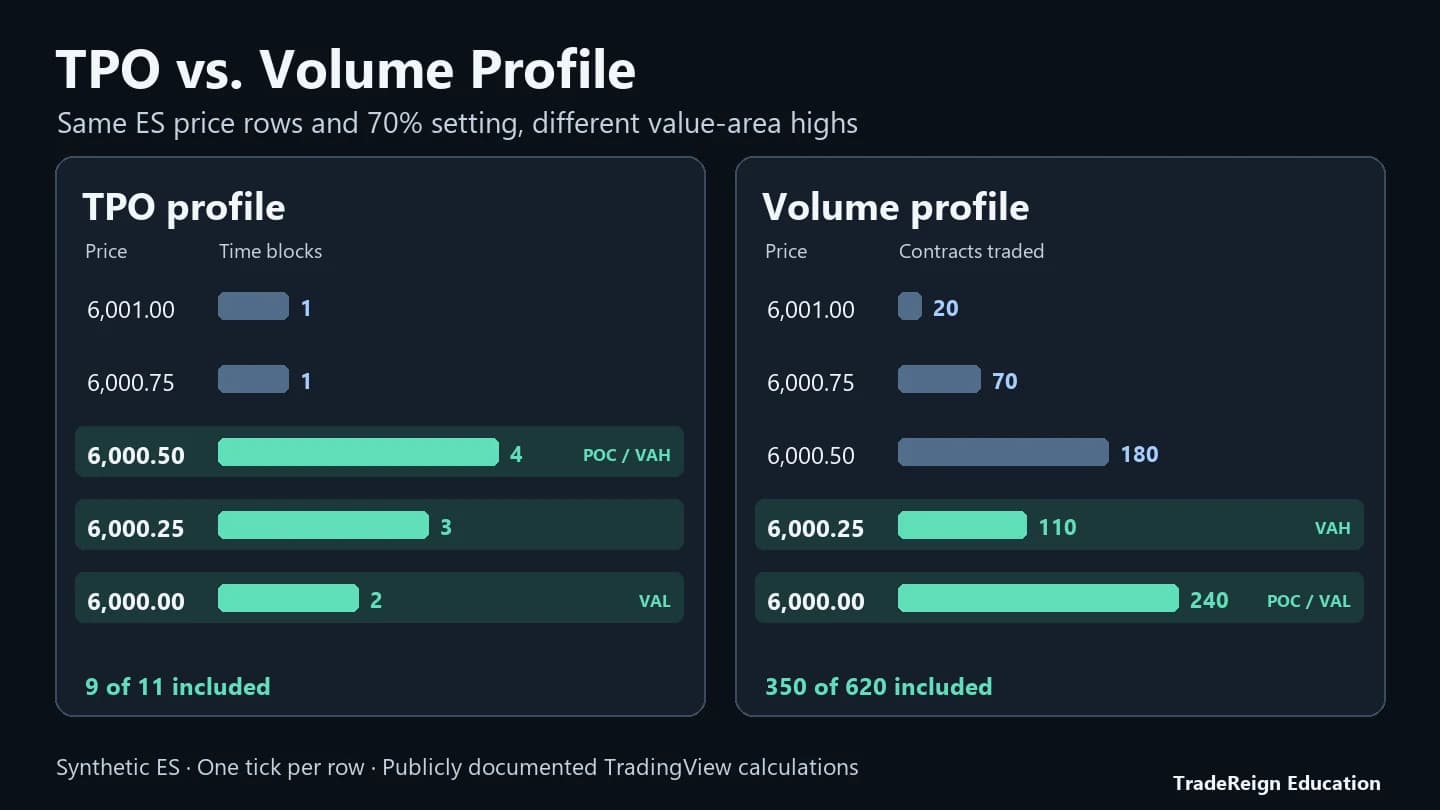
In the example, four time blocks reached 6,000.50. That is the TPO point of control. The 6,000.00 row traded during only two blocks but logged the most contracts of any row, 240, making it the volume point of control.
Using TradingView’s documented TPO value-area method at 70%, start with the four blocks at 6,000.50. There are 11 blocks in all, so the target is 7.7. Add 6,000.25 with three blocks, then 6,000.00 with two. The final row brings the total to nine blocks. The TPO value area high (VAH) is 6,000.50 and the value area low (VAL) is 6,000.00.
Apply TradingView’s documented Volume Profile rule to the same fictional rows. The target is 70% of 620 contracts, or 434. Start at the 240-contract POC at 6,000.00 and add 110 at 6,000.25. Adding the next 180-contract row would exceed the target, so that rule stops at 350 contracts. The volume VAH is 6,000.25 and the VAL is 6,000.00. The 70% setting can produce an included share below 70% when the next whole row would put it over the target.
When a live comparison disagrees, pick a completed profile and record its dated contract, session start and end, time zone, block duration, row increment, POC basis and value area method. If you carry a value area high into a replay exercise, record which profile produced it. In this example, a price of 6,000.50 is at the TPO value area high and one tick above the volume value area high.
Platform details on this page were checked against these official resources.
Read the same close with unchanged and fully higher value.
Compare cash-hours prices and exchange settlement with built-in studies.
Check how splitting a Tradovate session changes the point of control.
See how one tick changes the outcome under ShadowTrader’s two-tick rule.
Match the observation time and price rows before marking the single-print area.
Compare peaks, a thin row and two possible revisits on synthetic MES data.
Compare a time-based profile with volume traded at each price.
Project the completed range above and below its edges on a worked MES chart.
See the difference between reaching the far edge before and after confirmation.
Mark the base and high, then log whether trade builds above it after the next open.
Compare the same ES prices at one tick and two ticks per row.
Compare two snapshots with the same session high, then see how a later session can repair it.
Set up a separate workspace for NYSE breadth, TICK and ES.
Mark the initial balance and compare common Market Profile opens.
Read value area and the volume point of control in a worked futures example.
Existing alerts retain the profile settings they had when created. Check the new completed profile and replace the old alert when it needs to use your revised settings.
Order Flow Volume Profile has a Price profile that marks a row for each 30-minute window in which it traded. Select Price profile and check the Times legend for the fixed letter schedule.
Monkey Bars uses numbers for the aggregation periods, while TradingView uses letters. Compare each block's start and end time and its session definition.
Futures trading contains substantial risk and is not suitable for every investor. TradeReign is a trading-discipline and rule-enforcement application. It does not provide trading advice, trade signals, investment recommendations, or performance guarantees.
TradeReign is not a broker-dealer, futures commission merchant, or investment advisor.
Futures trading contains substantial risk and is not for every investor. An investor could potentially lose all or more than the initial investment. Only risk capital - money that can be lost without jeopardizing financial security or lifestyle - should be used for trading. Past performance is not necessarily indicative of future results.