Mark the boundary rows
Record the highest and lowest single-print rows so you can tell which side a revisit entered from.

Record the highest and lowest single-print rows so you can tell which side a revisit entered from.
One later period can fill several single-print rows. Compare the original profile with the current one at each close.
Revisit the earlier snapshot at session end. Keep the initial observation even if the final profile looks different.
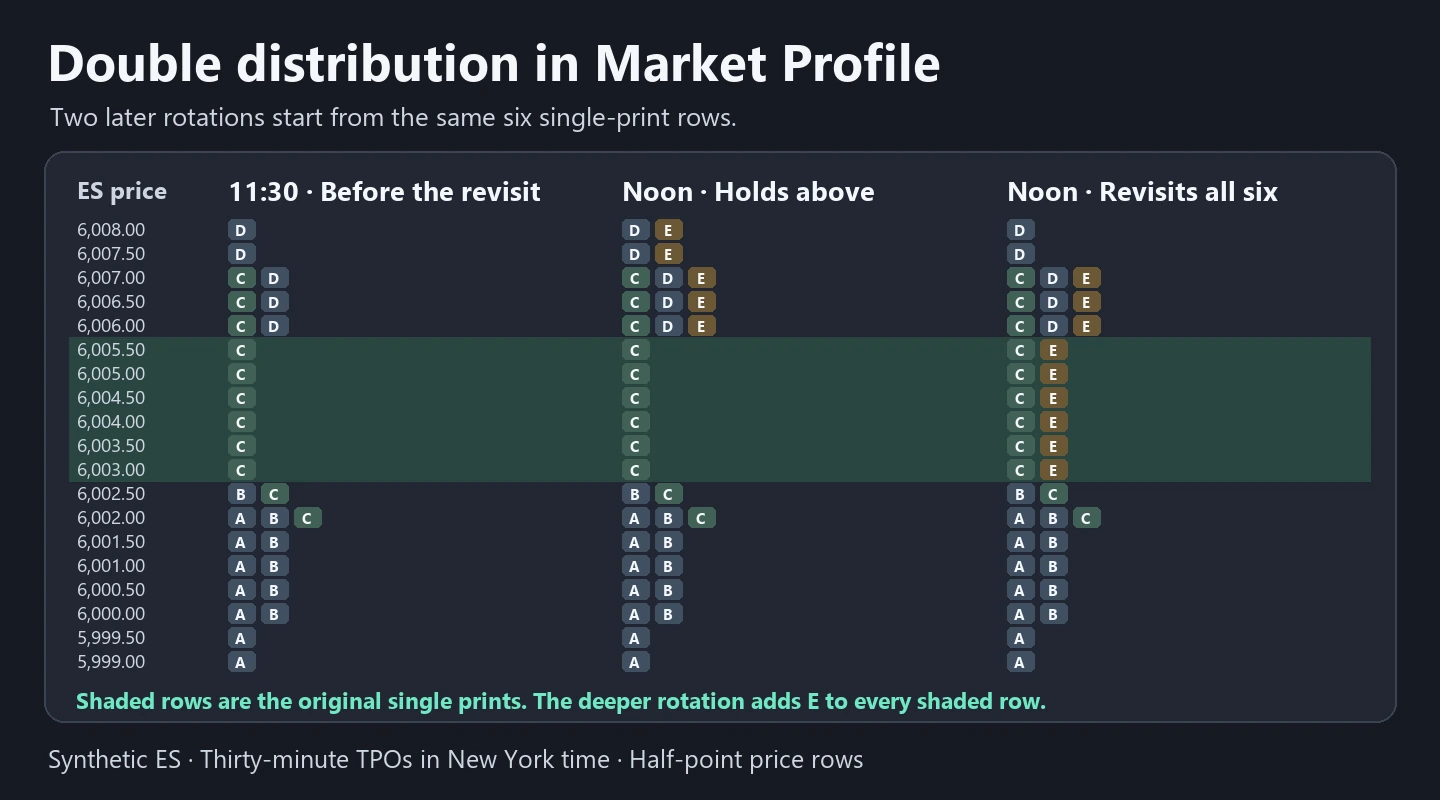
In the example, A and B overlap in the lower area. C extends higher, then D spends another period in the upper area. At 11:30 ET, C is the only letter from 6,003.00 through 6,005.50. That leaves six half-point rows between the two areas. ShadowTrader describes two distributions with single prints separating them.
Save the profile as it stood at 11:30. One wide period can put its letter on many prices at once. Use the overlapping letters at the upper prices to see where a second completed period traded. Treat the shape as a developing observation until the chosen session ends.
| Price | 11:30 ET | Noon, holds | Noon, rotates lower |
|---|---|---|---|
| 6,008.00 | |||
| 6,007.50 | |||
| 6,007.00 | |||
| 6,006.50 | |||
| 6,006.00 | |||
| 6,005.50 | |||
| 6,005.00 | |||
| 6,004.50 | |||
| 6,004.00 | |||
| 6,003.50 | |||
| 6,003.00 | |||
| 6,002.50 | |||
| 6,002.00 | |||
| 6,001.50 | |||
| 6,001.00 | |||
| 6,000.50 | |||
| 6,000.00 | |||
| 5,999.50 | |||
| 5,999.00 |
In the first path, E trades down to 6,006.00 and stays in the upper area. No shaded row gains a letter by noon. A hypothetical low of 6,005.50 would add E to just the top shaded row, leaving five single-print rows below it.
In the second path, E trades down to 6,003.00. Every shaded row now has C and E. The original single-print area is fully revisited by noon. This tells you which prices traded during E. The TPO row alone cannot tell you whether price stayed lower after the revisit.
In replay, record the time you first marked the area, the actual prices revisited and the number of single-print rows still open. Use the original snapshot to score your observation after the session. For a rule that uses completed periods, wait for each period to close before scoring its letters.
A TPO shows that a row traded during a period. Volume profile counts the contracts traded there. A row with one TPO can still have substantial volume during that one period. A two-node volume profile therefore answers a separate question from a two-distribution TPO profile.
Use the same session window, contract, price increment and TPO period length when comparing profile shapes across platforms. Wider rows can merge nearby prices and change which rows appear single. Read the settings before comparing a second profile with this example.
Platform details on this page were checked against these official resources.
Compare an interior single print with the edges of the auction.
Check session hours, time blocks and price rows before comparing profiles.
Read traded contracts at a price alongside the time-based study.
Look for overlap across different completed periods in each area, with only one letter on the intervening rows. Subsequent periods can change the shape.
For the same session and row settings, the original area is fully revisited once each previously single row has another TPO letter. A partial revisit adds a letter to only some of those rows.
Futures trading contains substantial risk and is not suitable for every investor. TradeReign is a trading-discipline and rule-enforcement application. It does not provide trading advice, trade signals, investment recommendations, or performance guarantees.
TradeReign is not a broker-dealer, futures commission merchant, or investment advisor.
Futures trading contains substantial risk and is not for every investor. An investor could potentially lose all or more than the initial investment. Only risk capital - money that can be lost without jeopardizing financial security or lifestyle - should be used for trading. Past performance is not necessarily indicative of future results.